
SAIL Q1 Results 2027: PAT Jumps 121% YoY, EBITDA Margin Expands to 15.82%
SAIL delivered a sharp improvement in profitability during Q1 FY27 as EBITDA increased 50% YoY and operating margin expanded to 15.82%, driving a 121% jump in net profit despite nearly flat revenue growth.

SAIL Q1 Results 2027: SAIL reported a strong Q1 FY27 performance with revenue from operations rising 1.25% YoY to ₹26,245.67 crore. Higher operating efficiency lifted EBITDA by 49.99% and expanded EBITDA margin to 15.82%, helping profit after tax more than double to ₹1,644.05 crore.
SAIL Q1 Results 2027: On 25 July, Steel Authority of India (SAIL) reported a strong improvement in profitability during Q1 FY27. While revenue from operations remained flat on a year-on-year basis, higher operating efficiency led to a sharp rise in earnings, with Profit After Tax (PAT) surging 120.80% YoY to ₹1,644.05 crore. Here is the detailed breakdown of SAIL Q1 results 2027
SAIL Q1 FY2027 Results Highlights
-
Revenue from Operations stood at ₹26,245.67 crore in Q1 FY27, registering 1.25% YoY growth from ₹25,921.76 crore in Q1 FY26. Compared with ₹30,813.49 crore in Q4 FY26, revenue declined 14.82%.
-
Total Revenue came in at ₹26,451.21 crore, up 1.41% YoY from ₹26,083.90 crore. Compared with ₹31,165.15 crore in Q4 FY26, total revenue declined 15.13%.
-
EBITDA (excluding Other Income) stood at ₹4,152.71 crore, compared with ₹2,768.66 crore in Q1 FY26, reflecting 49.99% YoY growth. Compared with ₹4,408.73 crore in Q4 FY26, EBITDA declined 5.81%.
-
EBITDA Margin improved to 15.82%, compared with 10.68% in Q1 FY26, expanding by 514 basis points. Compared with 14.31% in Q4 FY26, EBITDA margin expanded by 151 basis points.
-
Profit After Tax (PAT) stood at ₹1,644.05 crore, compared with ₹744.58 crore in Q1 FY26, reflecting 120.80% YoY growth. Compared with ₹1,835.47 crore in Q4 FY26, PAT declined 10.43%.
-
PAT Margin stood at 6.26%, compared with 2.87% in Q1 FY26, expanding by 339 basis points. Compared with 5.96% in Q4 FY26, PAT margin improved by 31 basis points.
|
Metric |
Q1 FY27 |
Q4 FY26 |
QoQ % |
Q1 FY26 |
YoY % |
|---|---|---|---|---|---|
|
Revenue from Operations (₹ Cr) |
26,245.67 |
30,813.49 |
-14.82% |
25,921.76 |
1.25% |
|
Total Revenue (₹ Cr) |
26,451.21 |
31,165.15 |
-15.13% |
26,083.90 |
1.41% |
|
EBITDA (Ex. Other Income) (₹ Cr) |
4,152.71 |
4,408.73 |
-5.81% |
2,768.66 |
49.99% |
|
EBITDA Margin |
15.82% |
14.31% |
+151 bps |
10.68% |
+514 bps |
|
PAT (₹ Cr) |
1,644.05 |
1,835.47 |
-10.43% |
744.58 |
120.80% |
|
PAT Margin |
6.26% |
5.96% |
+31 bps |
2.87% |
+339 bps |
|
EPS (₹) |
3.98 |
4.44 |
-10.36% |
1.80 |
121.11% |
Source: SAIL Q1 FY27 Financial Results.
Read this: NTPC Q1 FY27 Results
SAIL Share Price Today
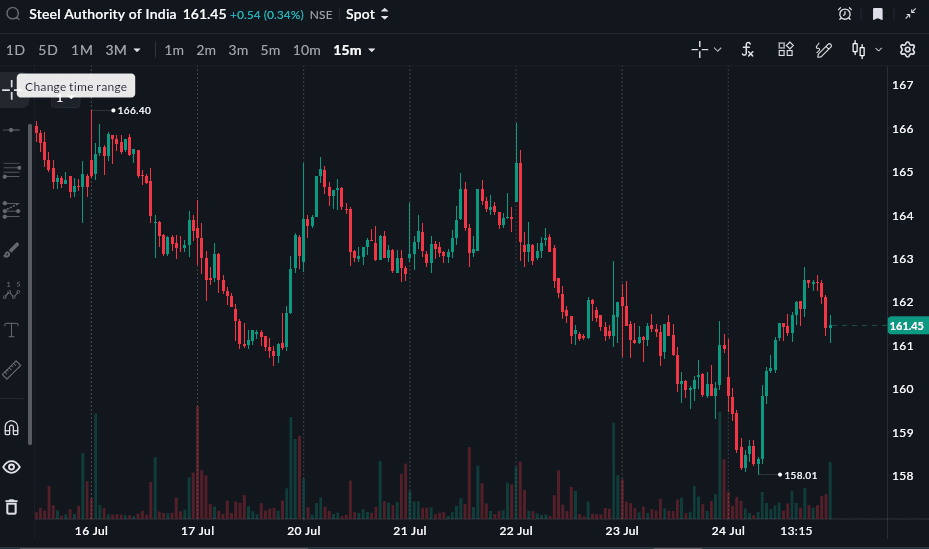
As of 24 July, 3:30 PM
SAIL Limited share price is trading at 161.45 (+0.34%) on 24 July 2026. The stock is Up 8.70% year-to-date and up 18.51% in one year from 24 July 2025 to 24 July 2026