
NTPC Q1 FY27 Results: Revenue Grows 8% YoY, PAT Rises 13%
NTPC posted higher revenue and double-digit profit growth in Q1 FY27, supported by a 29% increase in EBITDA and expansion in operating margins.

NTPC Q1 Results 2027: NTPC reported a healthy Q1 FY27 performance with revenue from operations rising 7.81% YoY to ₹50,740.96 crore. EBITDA grew 29.03% YoY with margin expanding to 31.99%, while profit after tax increased 12.90% YoY to ₹6,896.44 crore.
NTPC Q1 Results 2027: On 24 July, NTPC reported a healthy performance for Q1 FY27, driven by steady growth in power generation and improved operating profitability. Revenue from operations increased 7.81% YoY to ₹50,740.96 crore, while Profit After Tax (PAT) rose 12.90% YoY to ₹6,896.44 crore despite a decline from the previous quarter.
NTPC Q1 FY2027 Results Highlights
-
Revenue from Operations stood at ₹50,740.96 crore in Q1 FY27, registering 7.81% YoY growth from ₹47,064.35 crore in Q1 FY26. Compared with ₹49,686.31 crore in Q4 FY26, revenue increased 2.12%.
-
Total Revenue came in at ₹51,141.51 crore, up 6.94% YoY from ₹47,821.11 crore. Compared with ₹50,410.58 crore in Q4 FY26, total revenue increased 1.45%.
-
EBITDA (excluding Other Income) stood at ₹16,230.59 crore, compared with ₹12,578.93 crore in Q1 FY26, reflecting 29.03% YoY growth. Compared with ₹15,319.02 crore in Q4 FY26, EBITDA increased 5.95%.
-
EBITDA Margin improved to 31.99%, compared with 26.73% in Q1 FY26, expanding by 526 basis points. Compared with 30.83% in Q4 FY26, EBITDA margin expanded by 116 basis points.
-
Profit After Tax (PAT) stood at ₹6,896.44 crore, compared with ₹6,108.46 crore in Q1 FY26, reflecting 12.90% YoY growth. Compared with ₹10,614.95 crore in Q4 FY26, PAT declined 35.03%.
|
Metric |
Q1 FY27 |
Q4 FY26 |
QoQ % |
Q1 FY26 |
YoY % |
|---|---|---|---|---|---|
|
Revenue from Operations (₹ Cr) |
50,740.96 |
49,686.31 |
2.12% |
47,064.35 |
7.81% |
|
Total Revenue (₹ Cr) |
51,141.51 |
50,410.58 |
1.45% |
47,821.11 |
6.94% |
|
EBITDA (Ex. Other Income) (₹ Cr) |
16,230.59 |
15,319.02 |
5.95% |
12,578.93 |
29.03% |
|
EBITDA Margin |
31.99% |
30.83% |
+116 bps |
26.73% |
+526 bps |
|
PAT (₹ Cr) |
6,896.44 |
10,614.95 |
-35.03% |
6,108.46 |
12.90% |
|
PAT Margin |
13.59% |
21.36% |
-777 bps |
12.98% |
+61 bps |
|
EPS (₹) |
6.93 |
10.81 |
-35.89% |
6.20 |
11.77% |
Source: NTPC Q1 FY27 Financial Results
READ THIS: Jindal Steel Q1 FY27 Results
NTPC Share Price Today
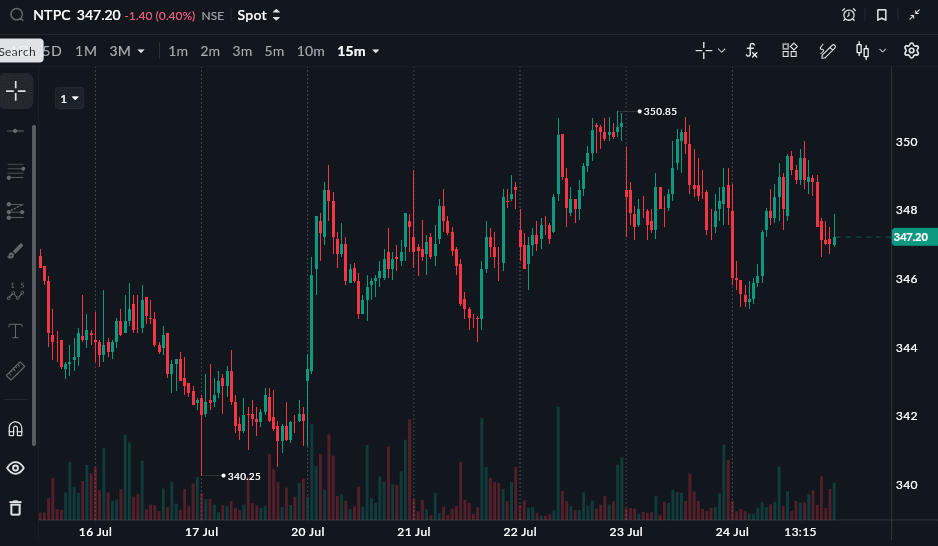
As of 24 July, 3:30 PM
NTPC share price closed at 347.20 (-0.40%) on 24 July 2026. The stock is up 3.39% year-to-date and up 2.60% in one year from 24 July 2025 to 24 July 2026