
Nestle India Q1 Results 2027: Revenue Rises 25% YoY, PAT Surges 48%
Nestlé India reported strong Q1 FY27 earnings, with revenue from operations rising to ₹6,378.18 crore and PAT increasing to ₹958.68 crore. EBITDA also improved, although margins moderated from the March quarter.

Nestle India Q1 Results FY2027: Nestlé India delivered a healthy Q1 FY27 performance, with revenue rising 25% YoY and PAT increasing 48% YoY. EBITDA improved strongly despite lower margins than Q4 FY26, while profitability moderated from the previous quarter amid softer operating performance and higher cost pressures.
Nestle India Q1 Results FY2027: On 22 July, Nestlé India reported a strong performance in the first quarter of FY27, supported by healthy demand across its product portfolio. Revenue from Operations increased 25.16% year-on-year to ₹6,378.18 crore.
Profit After Tax (PAT) rose 48.27% YoY to ₹958.68 crore, although earnings moderated compared with the previous quarter due to lower operating margins. Here are detailed breakdown of Nestle Q1 result 2027
Nestle India Q1 Results 2027 Highlights
-
Revenue from Operations stood at ₹6,378.18 crore in Q1 FY27, registering 25.16% YoY growth from ₹5,096.16 crore in Q1 FY26. Compared with ₹6,747.79 crore in Q4 FY26, revenue declined 5.48%.
-
Total Revenue came in at ₹6,400.65 crore, up 25.49% YoY from ₹5,100.33 crore and down 5.40% from ₹6,766.24 crore in Q4 FY26.
-
EBITDA increased to ₹1,538.13 crore, compared with ₹1,100.13 crore in Q1 FY26, reflecting 39.81% YoY growth. However, EBITDA declined 13.18% from ₹1,771.60 crore in Q4 FY26.
-
EBITDA Margin stood at 24.12%, compared with 21.59% in Q1 FY26 and 26.25% in Q4 FY26, expanding by 253 basis points YoY but contracting by 214 basis points from Q4 FY26.
-
Profit After Tax (PAT) stood at ₹958.68 crore, up 48.27% YoY from ₹646.59 crore in Q1 FY26. Compared with ₹1,110.90 crore in Q4 FY26, PAT declined 13.70%.
-
Earnings Per Share (EPS) stood at ₹4.97, compared with ₹3.35 in Q1 FY26, registering 48.36% YoY growth. Compared with ₹5.77 in Q4 FY26, EPS declined 13.86%.
|
Metric |
Q1 FY27 |
Q4 FY26 |
QoQ % |
Q1 FY26 |
YoY % |
|---|---|---|---|---|---|
|
Revenue from Operations (₹ Cr) |
6,378.18 |
6,747.79 |
-5.48% |
5,096.16 |
25.16% |
|
Total Revenue (₹ Cr) |
6,400.65 |
6,766.24 |
-5.40% |
5,100.33 |
25.49% |
|
EBITDA (₹ Cr) |
1,538.13 |
1,771.60 |
-13.18% |
1,100.13 |
39.81% |
|
EBITDA Margin |
24.12% |
26.25% |
-214 bps |
21.59% |
+253 bps |
|
PAT (₹ Cr) |
958.68 |
1,110.90 |
-13.70% |
646.59 |
48.27% |
|
PAT Margin |
15.03% |
16.46% |
-143 bps |
12.69% |
+234 bps |
|
EPS (₹) |
4.97 |
5.77 |
-13.86% |
3.35 |
48.36% |
Source: Nestlé India Limited Q1 FY27 Financial Results.
Nestlé India Share Price Today
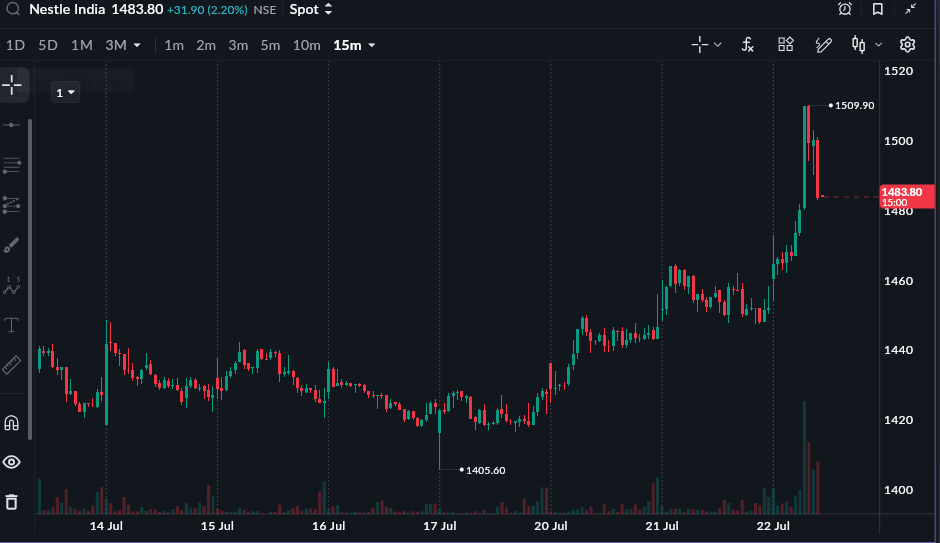
As of 22 July, 12 PM
Nestlé India share price is trading at 1500.10 (+3.19%) on 22 July 2026. The stock is up 15.66% year-to-date and 22.59% in one year.