
One MobiKwik Q1 Results FY2027: PAT Rebounds to ₹7.61 Cr, Revenue Up 3% YoY
MobiKwik returned to profitability in Q1 FY27 as PAT turned positive and operating margins improved, despite modest revenue growth and a slight sequential decline in revenue.

One MobiKwik Q1 Results 2027: One MobiKwik Systems reported a profitable turn for Q1 FY27, with Profit After Tax (PAT) reaching ₹7.61 crore compared to a net loss of ₹41.92 crore in Q1 FY26. While Revenue from Operations registered year-on-year growth, profitability improved significantly across all operating levels.
One MobiKwik Q1 Results 2027: On 3 August 2026, MobiKwik announced its financial results for the quarter ended 30 June 2026. Revenue from Operations increased 3.73% YoY to ₹281.48 crore, while Profit After Tax (PAT) turned positive at ₹7.61 crore.
MobiKwik share price trading at 3.02% higher at ₹211.66 at the time of writing on 3 August 2026. The stock is down 8% year to date and down 10% over the one-year period from 3 August 2025 to 3 August 2026.
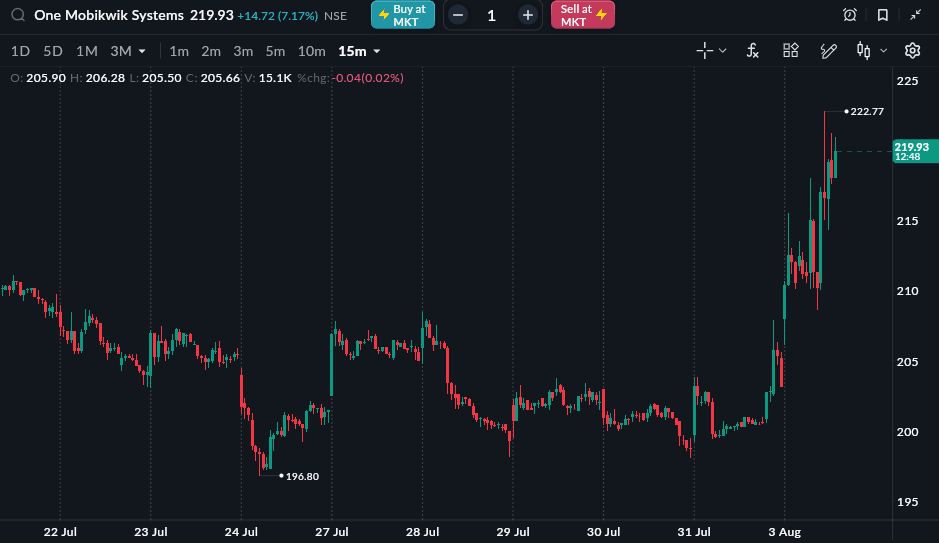
A of 3 Aug, 12:47 PM
READ THIS ALSO: Muthoot Finance Q1 Results 2027
MobiKwik Q1 FY27 Results Highlights
-
Revenue from Operations stood at ₹281.48 crore, up 3.73% YoY from ₹271.36 crore. Compared with ₹288.71 crore in Q4 FY26, revenue declined 2.50% QoQ.
-
Total Revenue stood at ₹289.15 crore, up 2.68% YoY from ₹281.61 crore. Compared with ₹296.03 crore in Q4 FY26, total revenue declined 2.32% QoQ.
-
PBITD (Excluding Other Income) stood at ₹8.11 crore, compared with a loss of ₹41.45 crore in Q1 FY26. Compared with ₹10.09 crore in Q4 FY26, it declined 19.62% QoQ.
-
PBITD (Including Other Income) stood at ₹15.78 crore, compared with a loss of ₹31.20 crore in Q1 FY26. Compared with ₹17.41 crore in Q4 FY26, it declined 9.36% QoQ.
-
Profit After Tax (PAT) stood at ₹7.61 crore, compared with a loss of ₹41.92 crore in Q1 FY26. Compared with ₹4.38 crore in Q4 FY26, PAT increased 73.74% QoQ.
-
PAT Margin stood at 2.71%, compared with -15.44% in Q1 FY26 and 1.52% in Q4 FY26, increasing 18.15 percentage points YoY and 1.19 percentage points QoQ.
-
EPS stood at ₹0.97, compared with -₹5.39 in Q1 FY26 and ₹0.56 in Q4 FY26.
|
Metric |
Q1 FY27 |
Q4 FY26 |
QoQ |
Q1 FY26 |
YoY |
|---|---|---|---|---|---|
|
Revenue from Operations (₹ Cr) |
281.48 |
288.71 |
-2.50% |
271.36 |
3.73% |
|
Total Revenue (₹ Cr) |
289.15 |
296.03 |
-2.32% |
281.61 |
2.68% |
|
PBITD (Excl. Other Income) (₹ Cr) |
8.11 |
10.09 |
-19.62% |
-41.45 |
Turnaround |
|
PBITD (Incl. Other Income) (₹ Cr) |
15.78 |
17.41 |
-9.36% |
-31.20 |
Turnaround |
|
Profit After Tax (₹ Cr) |
7.61 |
4.38 |
73.74% |
-41.92 |
Turnaround |
|
PAT Margin |
2.71% |
1.52% |
+1.19 ppt |
-15.44% |
+18.15 ppt |
|
EPS (₹) |
0.97 |
0.56 |
73.21% |
-5.39 |
Turnaround |
Source: Company Filing
All topics
Click the link, confirm the box next to sahi.com is checked — ignore any other results.