
JK Tyre Q1 Results 2027: PAT Falls 73% to ₹44 Cr, Revenue Up 2%
JK Tyre reported a marginal rise in revenue during Q1 FY27, but sharp pressure on operating margins led to a 73% decline in net profit and a significant drop in EBITDA.

JK Tyre & Industries Q1 Result FY27: JK Tyre & Industries reported flat top-line performance with severe margin contraction in Q1 FY27. While consolidated revenue grew marginally by 2% YoY, sharp operational cost pressures heavily dented EBITDA and net profit.
JK Tyre & Industries Q1 Result FY27: On 7 August 2026, JK Tyre & Industries announced its financial results for the first quarter ended 30 June 2026. Revenue from Operations increased 2.00% YoY to ₹3,946.24 crore compared with ₹3,868.94 crore in Q1 FY26.
While Profit After Tax (PAT) declined 73.01% YoY to ₹44.09 crore compared with ₹163.35 crore in Q1 FY26. EBITDA Margin stood at 6.54% during the quarter.
JK Tyre & Industries share price closed 4.05% lower on 7 August 2026. The stock has delivered -23% returns year-to-date and 22% returns over the one year from 7 August 2025 to 7 August 2026.
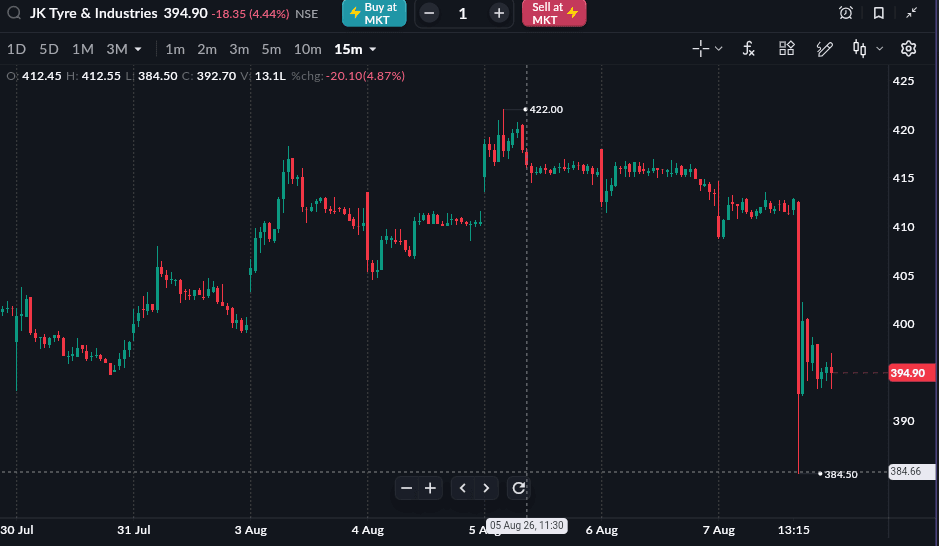
As of 7 Aug, 3:30 PM
READ THIS ALSO: SBI Q1 Results 2027
JK Tyre & Industries Q1 FY27 Results Highlights
-
Revenue from Operations stood at ₹3,946.24 crore, registering a 2.00% YoY increase from ₹3,868.94 crore in Q1 FY26. Compared with ₹4,223.44 crore in Q4 FY26, revenue decreased 6.56% QoQ.
-
Total Revenue stood at ₹3,955.66 crore, registering a 1.67% YoY increase from ₹3,890.57 crore in Q1 FY26. Compared with ₹4,232.83 crore in Q4 FY26, total revenue decreased 6.55% QoQ.
-
EBITDA (Excluding Other Income) stood at ₹258.22 crore, compared with ₹402.13 crore in Q1 FY26, registering a 35.79% YoY decrease. Compared with ₹537.07 crore in Q4 FY26, EBITDA decreased 51.92% QoQ.
-
EBITDA Margin stood at 6.54%, compared with 10.39% in Q1 FY26 and 12.72% in Q4 FY26, declining by 3.85 percentage points YoY and 6.17 percentage points QoQ.
-
Profit After Tax (PAT) stood at ₹44.09 crore, compared with ₹163.35 crore in Q1 FY26, registering a 73.01% YoY decrease. Compared with ₹177.96 crore in Q4 FY26, PAT decreased 75.22% QoQ.
-
PAT Margin stood at 1.12%, compared with 4.22% in Q1 FY26 and 4.21% in Q4 FY26, declining by 3.10 percentage points YoY and 3.10 percentage points QoQ.
-
EPS stood at ₹1.55, compared with ₹5.74 in Q1 FY26, registering a 73.00% YoY decrease. Compared with ₹6.25 in Q4 FY26, EPS decreased 75.20% QoQ.
|
Metric |
Q1 FY27 |
Q4 FY26 |
QoQ % |
Q1 FY26 |
YoY % |
|---|---|---|---|---|---|
|
Revenue from Operations (₹ Cr) |
3,946.24 |
4,223.44 |
-6.56% |
3,868.94 |
2.00% |
|
Total Revenue (₹ Cr) |
3,955.66 |
4,232.83 |
-6.55% |
3,890.57 |
1.67% |
|
EBITDA (Excl. Other Income) (₹ Cr) |
258.22 |
537.07 |
-51.92% |
402.13 |
-35.79% |
|
EBITDA Margin |
6.54% |
12.72% |
-6.17 pp |
10.39% |
-3.85 pp |
|
PAT (₹ Cr) |
44.09 |
177.96 |
-75.22% |
163.35 |
-73.01% |
|
PAT Margin |
1.12% |
4.21% |
-3.10 pp |
4.22% |
-3.10 pp |
|
EPS (₹) |
1.55 |
6.25 |
-75.20% |
5.74 |
-73.00% |
JK Tyre & Industries Q1 Segment-wise Performance
JK Tyre & Industries reported steady volume growth in its domestic India business, while performance in its international Mexico subsidiary faced sharp headwinds during the quarter.
|
Segment (₹ Cr) |
Q1 FY27 |
Q4 FY26 |
QoQ % |
Q1 FY26 |
YoY % |
|---|---|---|---|---|---|
|
India |
3,924.46 |
3,903.00 |
0.54% |
3,453.42 |
13.64% |
|
Mexico |
89.28 |
378.00 |
-76.35% |
505.34 |
-82.33% |
|
Others |
0.90 |
1.00 |
-17.43% |
0.00 |
- |
|
Total Revenue from Operations |
3,946.24 |
4,223.44 |
-6.56% |
3,868.94 |
2.00% |
Source: Company Filing
All topics
Click the link, confirm the box next to sahi.com is checked — ignore any other results.