
ITC Q1 Results 2027: PAT Falls 16%, Revenue Up 28%
ITC reported strong revenue growth in Q1 FY27, but higher excise duty on cigarettes weighed on margins, leading to a decline in profit despite strong performance across FMCG businesses.

ITC Q1 FY27 Results 2027: Consolidated revenue from operations rose 27.6% year-on-year to ₹29,523.30 crore. Profit attributable to owners fell 16.2% to ₹4,394.13 crore as cigarette segment margins narrowed sharply after the February excise duty hike.
ITC Q1 Results 2027: On 31 July 2026, ITC reported its Q1 FY27 results, with consolidated profit falling 16% year-on-year to ₹4,394.13 crore, while total income increased 26% YoY to ₹30,179.01 crore.
Ahead of the Q1 FY27 results, ITC shares closed 1.42% lower. However, the stock is down 32% over the one year from 31 July 2025 to 31 July 2026.
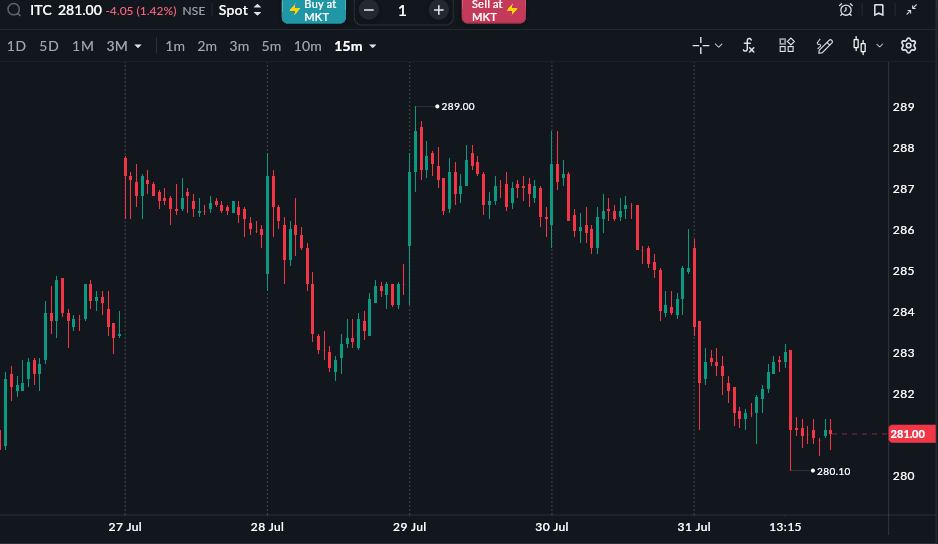
As of 31 July, 3.30 PM
READ THIS ALSO: Bajaj Holdings Q1 Results 2027
ITC Q1 FY27 Results Highlights (Consolidated)
-
ITC's consolidated revenue from operations came in at ₹29,523.30 crore for the quarter ended June 2026, up 27.64% from ₹23,129.35 crore a year earlier and up 23.94% from ₹23,821.48 crore in the preceding quarter.
-
Total income followed the same pattern, at ₹30,179.01 crore, up 26.74% year-on-year and 23.65% over the previous quarter, aided also by other income of ₹655.71 crore.
-
EBITDA stood at ₹5,180.86 crore. That is down 23.99% from ₹6,816.47 crore a year ago and down 25.18% from ₹6,924.23 crore in the March quarter.
-
Consolidated profit attributable to owners of the company came in at ₹4,394.13 crore, down 16.21% year-on-year from ₹5,244.20 crore and down 18.45% quarter-on-quarter from ₹5,387.97 crore.
-
Diluted EPS came to ₹3.51, against ₹4.18 in the year-ago quarter and ₹4.30 in the previous quarter.
|
Metric |
Q1 FY27 |
Q4 FY26 |
QoQ % |
Q1 FY26 |
YoY % |
|---|---|---|---|---|---|
|
Revenue from Ops (₹ Cr) |
29,523.30 |
23,821.48 |
23.94% |
23,129.35 |
27.64% |
|
Total Income (₹ Cr) |
30,179.01 |
24,406.63 |
23.65% |
23,811.56 |
26.74% |
|
EBITDA (₹ Cr) |
5,180.86 |
6,924.23 |
-25.18% |
6,816.47 |
-23.99% |
|
PAT (₹ Cr, owners) |
4,394.13 |
5,387.97 |
-18.45% |
5,244.20 |
-16.21% |
|
EPS — Diluted (₹) |
3.51 |
4.30 |
-18.37% |
4.18 |
-16.03% |
Source: NSE filing, ITC Limited Q1 FY27 Consolidated Financial Results dated 31 July 2026
ITC Q1 Segment-wise Performance
ITC's FMCG business remained the biggest growth driver in Q1 FY27, with the cigarettes segment surging 73.72% YoY and the non-cigarette FMCG business growing 15.30%. However, the agri business declined 16.31%, partly offsetting gains in other segments.
|
Segment |
Q1 FY27 (₹ Cr) |
Q1 FY26 (₹ Cr) |
YoY% |
|---|---|---|---|
|
FMCG – Cigarettes |
16,596.67 |
9,553.86 |
73.72% |
|
FMCG – Others |
6,687.90 |
5,800.44 |
15.30% |
|
Total FMCG |
23,284.57 |
15,354.30 |
51.65% |
|
Agri Business |
8,137.81 |
9,723.84 |
-16.31% |
|
Paperboards, Paper & Packaging |
2,310.27 |
2,116.62 |
9.15% |
|
Others |
1,379.50 |
1,182.59 |
16.65% |