
Godfrey Phillips India Results 2027: PAT Declines 44% YoY; Revenue Doubles
Godfrey Phillips India posted a sharp rise in revenue during Q1 FY27, but lower operating margins led to a steep decline in quarterly profit and profitability.

Godfrey Phillips India Q1 Results 2027: Godfrey Phillips India reported a mixed Q1 FY27 performance, with revenue from operations surging 110.65% YoY to ₹3,819.56 crore, while Profit After Tax (PAT) declined 44.32% YoY to ₹198.39 crore. EBITDA margins also contracted significantly during the quarter.
Godfrey Phillips India Q1 Results 2027: On 27 July, Godfrey Phillips India reported its financial performance for the first quarter of FY27. Revenue from operations increased 110.65% year-on-year to ₹3,819.56 crore, while Profit After Tax (PAT) declined 44.32% YoY to ₹198.39 crore.
Godfrey Phillips India Q1 FY27 Results Highlights
-
Revenue from Operations increased to ₹3,819.56 crore, up 110.65% YoY from ₹1,813.26 crore. Compared with ₹3,485.54 crore in Q4 FY26, revenue increased 9.58% QoQ.
-
Total Revenue stood at ₹3,897.83 crore in Q1 FY27, registering a 106.24% YoY increase from ₹1,889.97 crore in Q1 FY26. Compared with ₹3,531.87 crore in Q4 FY26, total revenue increased 10.36% QoQ.
-
EBITDA (Excluding Other Income) stood at ₹181.44 crore, declining 46.25% YoY from ₹337.57 crore. Compared with ₹552.75 crore in Q4 FY26, EBITDA declined 67.18% QoQ.
-
EBITDA Margin stood at 4.75%, compared with 18.62% in Q1 FY26 and 15.86% in Q4 FY26, declining by 13.87 percentage points YoY and 11.11 percentage points QoQ.
-
Profit After Tax (PAT) stood at ₹198.39 crore, declining 44.32% YoY from ₹356.28 crore. Compared with ₹520.76 crore in Q4 FY26, PAT declined 61.90% QoQ.
-
PAT Margin stood at 5.19%, compared with 19.65% in Q1 FY26 and 14.94% in Q4 FY26, declining by 14.45 percentage points YoY and 9.75 percentage points QoQ.
|
Metric |
Q1 FY27 |
Q4 FY26 |
QoQ % |
Q1 FY26 |
YoY % |
|---|---|---|---|---|---|
|
Revenue from Operations (₹ Cr) |
3,819.56 |
3,485.54 |
9.58% |
1,813.26 |
110.65% |
|
Total Revenue (₹ Cr) |
3,897.83 |
3,531.87 |
10.36% |
1,889.97 |
106.24% |
|
EBITDA (Ex. Other Income) (₹ Cr) |
181.44 |
552.75 |
-67.18% |
337.57 |
-46.25% |
|
EBITDA Margin |
4.75% |
15.86% |
-11.11% |
18.62% |
-13.87% |
|
PAT (₹ Cr) |
198.39 |
520.76 |
-61.90% |
356.28 |
-44.32% |
|
PAT Margin |
5.19% |
14.94% |
-9.75% |
19.65% |
-14.45% |
|
EPS (₹) |
12.72 |
33.39 |
-61.90% |
22.84 |
-44.31% |
Source: Godfrey Phillips India Q1 FY27 Financial Results.
Godfrey Phillips India Q1 FY27 Segment-wise Revenue
The Cigarettes, Tobacco and Related Products segment remained the company's primary revenue contributor, recording strong double-digit growth during the quarter. The Others segment also reported healthy growth on both a sequential and year-on-year basis.
|
Particulars (₹ Cr) |
Q1 FY27 |
Q4 FY26 |
QoQ % |
Q1 FY26 |
YoY % |
|---|---|---|---|---|---|
|
Cigarettes, Tobacco and Related Products |
3,779.81 |
3,461.81 |
9.19% |
1,781.36 |
112.19% |
|
Others |
39.75 |
23.73 |
67.51% |
31.90 |
24.61% |
|
Revenue from Operations |
3,819.56 |
3,485.54 |
9.58% |
1,813.26 |
110.65% |
Source: Godfrey Phillips India Q1 FY27 Segment Information.
READ THIS ALSO: Bharat Electronics Q1 Results 2027
Godfrey Phillips India Share Price Today
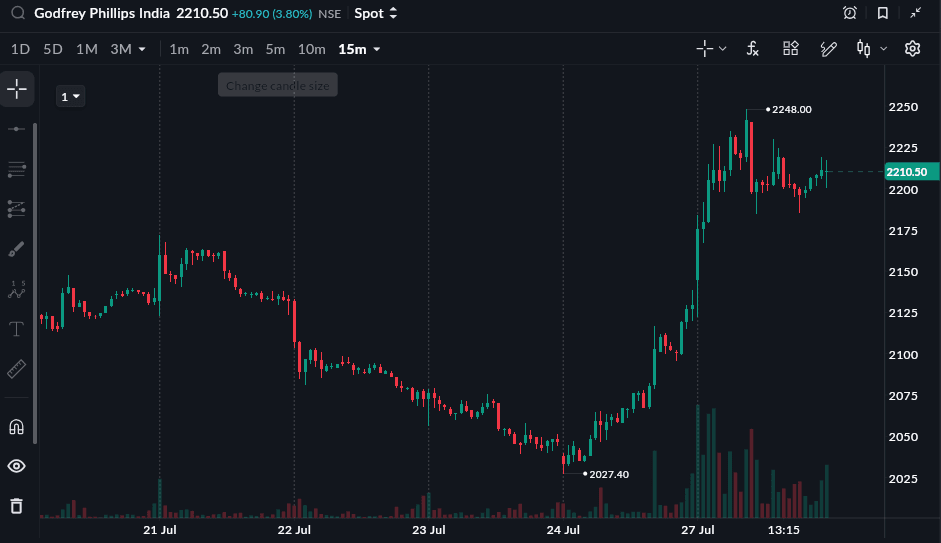
As of 27 July, 3:30 PM
Godfrey Phillips India share price closed at 2210.50 (+3.80%) on 27 July 2026. The stock is down 3.28% year-to-date and down 24.28% in one year from 27 July 2025 to 27 July 2026