
Bharat Electronics Q1 Results 2027: PAT Rises 9% YoY; Revenue Grows 25%
Revenue increased nearly 25% year-on-year in Q1 FY27, but lower operating margins kept profit growth below double digits.

Bharat Electronics Q1 Results 2027: Bharat Electronics reported a healthy Q1 FY27 performance, with PAT rising 8.82% YoY to ₹1,054.53 crore and revenue from operations increasing 24.94% YoY to ₹5,546.98 crore. However, profitability moderated on a sequential basis due to the high base of the previous quarter..
Bharat Electronics Q1 Results 2027: On 27 July, Bharat Electronics reported its financial performance for the first quarter of FY27. Revenue from operations increased 24.94% year-on-year to ₹5,546.98 crore, while Profit After Tax (PAT) rose 8.82% YoY to ₹1,054.53 crore.
Bharat Electronics Q1 FY27 Results Highlights
-
Revenue from Operations increased to ₹5,546.98 crore, up 24.94% YoY from ₹4,439.74 crore. Compared with ₹10,224.43 crore in Q4 FY26, revenue declined 45.75% QoQ.
-
Total Revenue stood at ₹5,716.54 crore in Q1 FY27, registering a 24.19% YoY increase from ₹4,603.06 crore in Q1 FY26. Compared with ₹10,334.68 crore in Q4 FY26, total revenue declined 44.69% QoQ.
-
EBITDA (Excluding Other Income) stood at ₹1,388.40 crore, registering 12.12% YoY growth from ₹1,238.27 crore. Compared with ₹2,981.65 crore in Q4 FY26, EBITDA declined 53.44% QoQ.
-
EBITDA Margin stood at 25.03%, compared with 27.89% in Q1 FY26 and 29.16% in Q4 FY26, declining by 4.13 percentage points QoQ and 2.86 percentage points YoY.
-
Profit After Tax (PAT) stood at ₹1,054.53 crore, rising 8.82% YoY from ₹969.05 crore. Compared with ₹2,226.35 crore in Q4 FY26, PAT declined 52.63% QoQ.
-
PAT Margin stood at 19.01%, compared with 21.83% in Q1 FY26 and 21.77% in Q4 FY26, declining by 2.76 percentage points QoQ and 2.82 percentage points YoY.
|
Metric |
Q1 FY27 |
Q4 FY26 |
QoQ % |
Q1 FY26 |
YoY % |
|---|---|---|---|---|---|
|
Revenue from Operations (₹ Cr) |
5,546.98 |
10,224.43 |
-45.75% |
4,439.74 |
24.94% |
|
Total Revenue (₹ Cr) |
5,716.54 |
10,334.68 |
-44.69% |
4,603.06 |
24.19% |
|
EBITDA (Ex. Other Income) (₹ Cr) |
1,388.40 |
2,981.65 |
-53.44% |
1,238.27 |
12.12% |
|
EBITDA Margin |
25.03% |
29.16% |
-4.13% |
27.89% |
-2.86% |
|
PAT (₹ Cr) |
1,054.53 |
2,226.35 |
-52.63% |
969.05 |
8.82% |
|
PAT Margin |
19.01% |
21.77% |
-2.76% |
21.83% |
-2.82% |
|
EPS (₹) |
1.44 |
3.04 |
-52.63% |
1.33 |
8.27% |
Source: Bharat Electronics Q1 FY27 Financial Results.
READ THIS: Indo-MIM IPO Allotment Status
Bharat Electronics Share Price Today
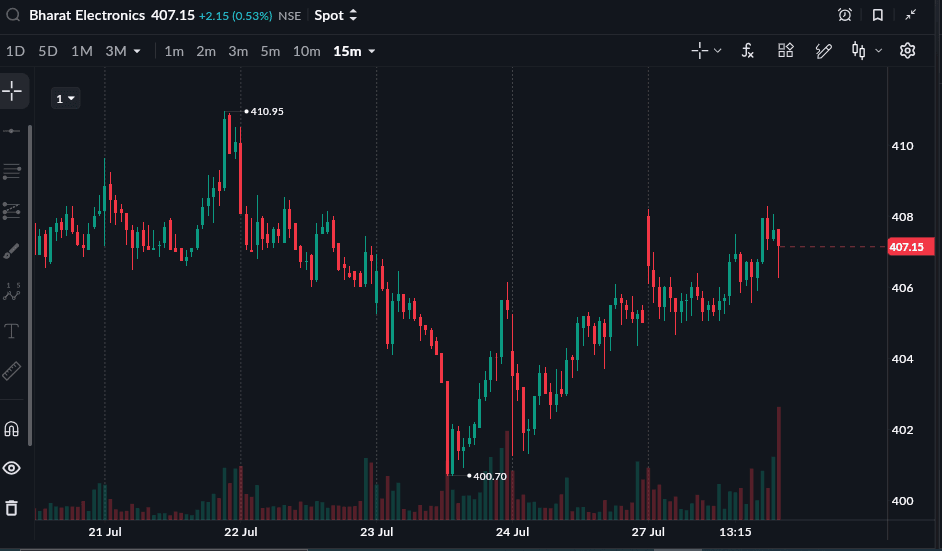
As of 27 July, 3:30 PM
Bharat Electronics share price closed at 407.15 (+0.53%) on 27 July 2026. The stock is up 2.26% year-to-date and up 2.91% in one year from 27 July 2025 to 27 July 2026