
Dr. Reddy's Q1 FY27 Results: PAT Declines 69% YoY
Dr. Reddy's Laboratories reported a weak Q1 FY27 with revenue from operations declining to ₹8,099.80 crore and PAT falling to ₹435.60 crore

Dr. Reddy's Laboratories Q1 Results 2027: Dr. Reddy's Laboratories reported a weak Q1 FY27 compared with last year, with revenue and profitability declining sharply. However, earnings improved considerably from Q4 FY26, supported by better operating performance, while the Global Generics business remained the company's primary revenue contributor.
Dr. Reddy's Q1 Results FY2027: On 22 July, Dr. Reddy's Laboratories reported a muted performance in the first quarter of FY27, with lower revenue and profitability. Revenue from Operations declined 5.51% year-on-year to ₹8,099.80 crore, while Profit After Tax (PAT) fell 69.10% YoY to ₹435.60 crore.
However, earnings improved from Q4 FY26, supported by better operating performance. Here is the detailed breakdown of Dr Reddy Q1 result 2027
Dr. Reddy's Laboratories Q1 FY2027 Results Highlights
-
Revenue from Operations stood at ₹8,099.80 crore in Q1 FY27, declining 5.51% YoY from ₹8,572.10 crore in Q1 FY26. Compared with ₹7,546.40 crore in Q4 FY26, revenue increased 7.33%.
-
Total Revenue came in at ₹8,454.50 crore, down 4.60% YoY from ₹8,862.40 crore and up 5.39% from ₹8,021.80 crore in Q4 FY26.
-
EBITDA (excluding Other Income) stood at ₹859.90 crore, compared with ₹2,173.60 crore in Q1 FY26, reflecting a 60.44% decline YoY. Compared with ₹382.50 crore in Q4 FY26, EBITDA increased 124.81%.
-
EBITDA Margin stood at 10.62%, compared with 25.36% in Q1 FY26 and 5.07% in Q4 FY26, contracting by 1,474 basis points YoY while expanding by 555 basis points from Q4 FY26.
-
Profit After Tax (PAT) stood at ₹435.60 crore, declining 69.10% YoY from ₹1,409.90 crore in Q1 FY26. Compared with ₹221.30 crore in Q4 FY26, PAT increased 96.84%. PAT Margin stood at 5.38%, compared with 16.45% in Q1 FY26 and 2.93% in Q4 FY26.
-
Earnings Per Share (EPS) stood at ₹5.33, compared with ₹17.04 in Q1 FY26, declining 68.72% YoY. Compared with ₹2.65 in Q4 FY26, EPS increased 101.13%.
|
Metric |
Q1 FY27 |
Q4 FY26 |
QoQ % |
Q1 FY26 |
YoY % |
|---|---|---|---|---|---|
|
Revenue from Operations (₹ Cr) |
8,099.80 |
7,546.40 |
7.33% |
8,572.10 |
-5.51% |
|
Total Revenue (₹ Cr) |
8,454.50 |
8,021.80 |
5.39% |
8,862.40 |
-4.60% |
|
EBITDA (₹ Cr) |
859.90 |
382.50 |
124.81% |
2,173.60 |
-60.44% |
|
EBITDA Margin |
10.62% |
5.07% |
+555 bps |
25.36% |
-1,474 bps |
|
PAT (₹ Cr) |
435.60 |
221.30 |
96.84% |
1,409.90 |
-69.10% |
|
PAT Margin |
5.38% |
2.93% |
+245 bps |
16.45% |
-1,107 bps |
|
EPS (₹) |
5.33 |
2.65 |
101.13% |
17.04 |
-68.72% |
Source: Dr. Reddy's Laboratories Limited Q1 FY27 Financial Results.
READ THIS ALSO: IndusInd Bank Q1 FY27 Results
Dr. Reddy's Laboratories Share Price Today
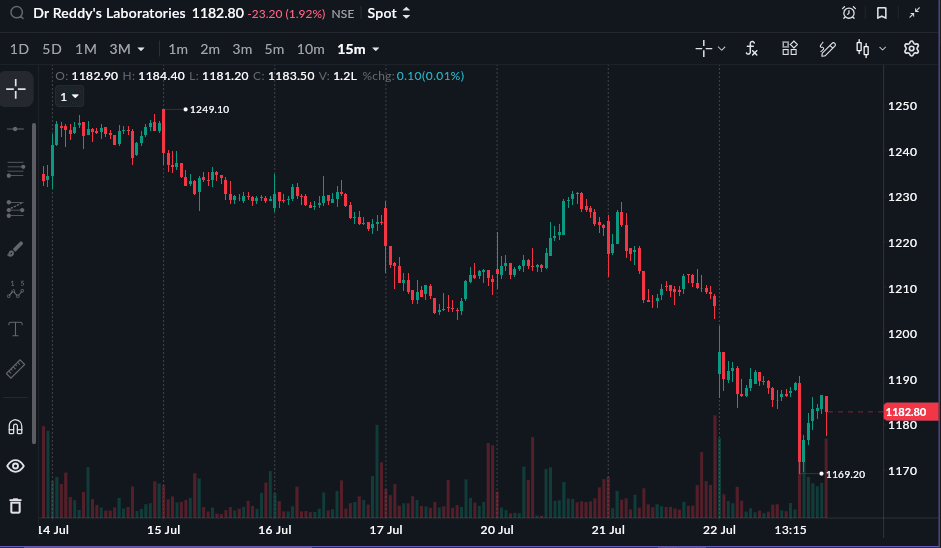
As of 22 July, 3:30 PM
Dr. Reddy's share price closed at 1182.80 (-1.92%) on 22 July 2026. The stock is down 5.86% year-to-date and 4.85% in one year from 22 July 2025 to 22 July 2026
All topics
Click the link, confirm the box next to sahi.com is checked — ignore any other results.