
IndusInd Bank Q1 FY27 Results: PAT Jumps 72% YoY, Asset Quality Improves
IndusInd Bank reported a strong Q1 FY27 with PAT rising to ₹1,037.05 crore and Net Interest Income increasing to ₹4,685 crore. The bank also reported better asset quality, with Gross and Net NPA ratios improving from both the previous quarter and a year ago.

IndusInd Bank Q1 Results FY2027: IndusInd Bank reported a strong Q1 FY27, with PAT rising 72% YoY and operating profit improving 8%. Asset quality strengthened further as Gross and Net NPAs declined, while higher net interest income and improved operating margins supported the bank's overall profitability.
IndusInd Bank Q1 Results FY2027: On 22 July, IndusInd Bank reported a strong earnings performance in the first quarter of FY27, driven by higher net interest income, improved operating profitability and better asset quality.
Profit After Tax (PAT) increased 71.68% year-on-year to ₹1,037.05 crore, while both Gross and Net NPA ratios improved from the same quarter last year and Q4 FY26. Here is the detailed breakdown of IndusInd bank Q1 results 2027
IndusInd Bank Q1 FY2027 Results Highlights
-
Total Income stood at ₹13,096.47 crore in Q1 FY27, declining 9.18% YoY from ₹14,420.80 crore in Q1 FY26. Compared with ₹12,719.08 crore in Q4 FY26, total income increased 2.97%.
-
Net Interest Income (NII) came in at ₹4,685 crore, up 0.97% YoY from ₹4,640 crore in Q1 FY26. Compared with ₹4,371 crore in Q4 FY26, NII increased 7.18%.
-
Pre-Provision Operating Profit (PPOP) stood at ₹2,773.45 crore, registering 8.03% YoY growth from ₹2,567.32 crore. Compared with ₹2,295.26 crore in Q4 FY26, PPOP increased 20.83%.
-
Operating Profit Margin improved to 21.18%, compared with 17.80% in Q1 FY26 and 18.05% in Q4 FY26, expanding by 338 basis points YoY and 313 basis points from Q4 FY26.
-
Net Interest Margin (NIM) improved to 3.57%, compared with 3.46% in Q1 FY26 and 3.39% in Q4 FY26.
-
Return on Assets (ROA) improved to 0.78%, while Return on Equity (ROE) increased to 6.26%.
-
Earnings Per Share (EPS) stood at ₹13.31, compared with ₹7.75 in Q1 FY26, registering 71.74% YoY growth. Compared with ₹7.62 in Q4 FY26, EPS increased 74.67%.
|
Metric |
Q1 FY27 |
Q4 FY26 |
QoQ % |
Q1 FY26 |
YoY % |
|---|---|---|---|---|---|
|
Total Income (₹ Cr) |
13,096.47 |
12,719.08 |
2.97% |
14,420.80 |
-9.18% |
|
Net Interest Income (₹ Cr) |
4,685.00 |
4,371.00 |
7.18% |
4,640.00 |
0.97% |
|
PPOP (₹ Cr) |
2,773.45 |
2,295.26 |
20.83% |
2,567.32 |
8.03% |
|
Operating Profit Margin |
21.18% |
18.05% |
+313 bps |
17.80% |
+338 bps |
|
PAT (₹ Cr) |
1,037.05 |
594.17 |
74.54% |
604.07 |
71.68% |
|
Gross NPA |
3.25% |
3.43% |
-18 bps |
3.64% |
-39 bps |
|
Net NPA |
0.95% |
1.00% |
-5 bps |
1.12% |
-17 bps |
|
CASA Ratio |
29.43% |
31.24% |
-181 bps |
31.48% |
-205 bps |
|
ROA |
0.78% |
0.45% |
+33 bps |
0.45% |
+33 bps |
|
ROE |
6.26% |
3.63% |
+263 bps |
3.71% |
+255 bps |
|
NIM |
3.57% |
3.39% |
+18 bps |
3.46% |
+11 bps |
|
EPS (₹) |
13.31 |
7.62 |
74.67% |
7.75 |
71.74% |
Source: IndusInd Bank Q1 FY27 Financial Results.
IndusInd Bank Segment-wise Performance
IndusInd Bank's business remained diversified across Retail Banking, Corporate & Wholesale Banking and Treasury Operations during the quarter.
Retail Banking continued to account for the largest share of operating income, while Corporate & Wholesale Banking recorded healthy growth.
|
Segment |
Q1 FY27 |
Q4 FY26 |
QoQ % |
Q1 FY26 |
YoY % |
|---|---|---|---|---|---|
|
Treasury Operations |
2,391.52 |
2,637.78 |
-9.34% |
3,008.59 |
-20.51% |
|
Corporate / Wholesale Banking |
3,227.72 |
3,009.48 |
7.25% |
2,810.35 |
14.85% |
|
Retail Banking |
8,162.23 |
8,161.45 |
0.01% |
9,488.05 |
-13.97% |
|
Other Banking Business |
0.01 |
3.11 |
-96.78% |
3.76 |
-99.73% |
|
Unallocated |
284.93 |
0.00 |
— |
44.83 |
535.58% |
|
Less: Inter-segment Revenue |
(969.94) |
(1,092.74) |
-11.24% |
(934.78) |
3.76% |
|
Total Income from Operations |
13,096.47 |
12,719.08 |
2.97% |
14,420.80 |
-9.18% |
Source: IndusInd Bank Q1 FY27 Financial Results.
READ THIS ALSO: Eternal Q1 FY27 Results
IndusInd Bank Share Price Today
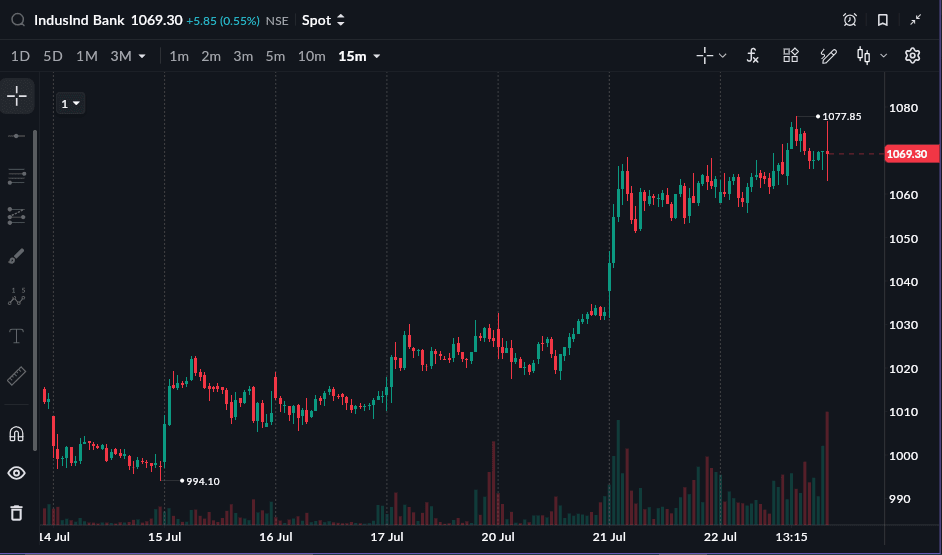
As of 22 July, 3:30 PM
Eternal share price closed at 1069.30 (+0.55%) on 22 July 2026. The stock is up 20.42% year-to-date and 27.13% in one year from 22 July 2025 to 22 July 2026
All topics
Click the link, confirm the box next to sahi.com is checked — ignore any other results.