
Cipla Q1 Results 2027: Revenue Grows 2% YoY, PAT Declines 39%
Cipla reported a mixed Q1 FY27 as revenue from operations rose to ₹7,119.28 crore, while profit declined on lower operating margins despite sequential improvement in earnings and profitability.

Cipla Q1 Results FY2027: Cipla reported a mixed Q1 FY27, with revenue posting modest growth despite a challenging base. Profitability remained under pressure due to lower operating margins, leading to a sharp decline in earnings compared with last year, although both operating profit and net profit improved from the previous quarter.
Cipla Q1 Results FY2027: On 23 July, Cipla reported a mixed performance in the first quarter of FY27. Revenue from Operations increased modestly on a year-on-year basis, supported by steady business growth across key markets.
However, profitability declined sharply due to lower operating margins, resulting in a fall in Profit After Tax compared with the corresponding quarter last year. Here is the detailed breakdown of Cipla Q1 results 2027
Cipla Q1 FY2027 Results Highlights
-
Revenue from Operations stood at ₹7,119.28 crore in Q1 FY27, registering 2.33% YoY growth from ₹6,957.47 crore in Q1 FY26. Compared with ₹6,541.20 crore in Q4 FY26, revenue increased 8.84%.
-
Total Revenue came in at ₹7,330.18 crore, up 1.58% YoY from ₹7,216.03 crore and 9.58% from ₹6,689.36 crore in Q4 FY26.
-
EBITDA (excluding Other Income) stood at ₹1,192.30 crore, compared with ₹1,778.14 crore in Q1 FY26, reflecting a 32.95% decline YoY. Compared with ₹954.95 crore in Q4 FY26, EBITDA increased 24.85%.
-
EBITDA Margin stood at 16.75%, compared with 25.56% in Q1 FY26 and 14.60% in Q4 FY26, contracting by 881 basis points YoY while expanding by 215 basis points from Q4 FY26.
-
Profit After Tax (PAT) stood at ₹785.55 crore, compared with ₹1,291.61 crore in Q1 FY26, declining 39.18% YoY. Compared with ₹542.51 crore in Q4 FY26, PAT increased 44.80%.
-
PAT Margin stood at 11.03%, compared with 18.56% in Q1 FY26 and 8.29% in Q4 FY26, contracting by 753 basis points YoY while expanding by 274 basis points from Q4 FY26.
-
Earnings Per Share (EPS) stood at ₹9.77, compared with ₹16.07 in Q1 FY26, declining 39.20% YoY. Compared with ₹6.87 in Q4 FY26, EPS increased 42.21%.
|
Metric |
Q1 FY27 |
Q4 FY26 |
QoQ % |
Q1 FY26 |
YoY % |
|---|---|---|---|---|---|
|
Revenue from Operations (₹ Cr) |
7,119.28 |
6,541.20 |
8.84% |
6,957.47 |
2.33% |
|
Total Revenue (₹ Cr) |
7,330.18 |
6,689.36 |
9.58% |
7,216.03 |
1.58% |
|
EBITDA (₹ Cr) |
1,192.30 |
954.95 |
24.85% |
1,778.14 |
-32.95% |
|
EBITDA Margin |
16.75% |
14.60% |
+215 bps |
25.56% |
-881 bps |
|
PAT (₹ Cr) |
785.55 |
542.51 |
44.80% |
1,291.61 |
-39.18% |
|
PAT Margin |
11.03% |
8.29% |
+274 bps |
18.56% |
-753 bps |
|
EPS (₹) |
9.77 |
6.87 |
42.21% |
16.07 |
-39.20% |
Source: Cipla Limited Q1 FY27 Financial Results
READ THIS ALSO: Dr. Reddy's Q1 FY27 Results
Cipla Share Price Today
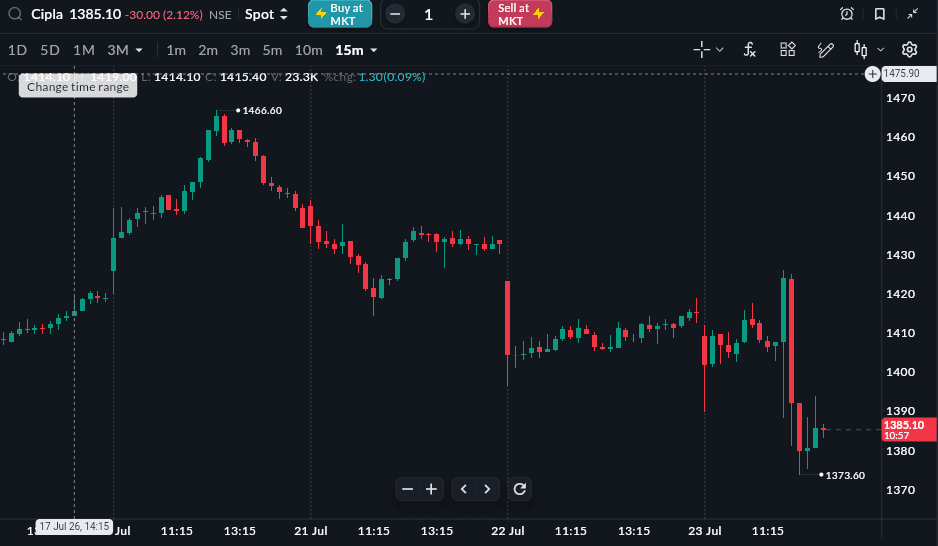
As of 23 July, 1:05 PM
Cipla share price is trading at 1386.90 (-1.99%) on 23 July 2026. The stock is down 7.52% year-to-date and 5.80% in one year from 23 July 2025 to 23 July 2026
All topics
Click the link, confirm the box next to sahi.com is checked — ignore any other results.