
Cera Sanitaryware Q1 Results 2027: Revenue Rises 19% YoY, PAT Decreases 3% to ₹45 Cr
Cera Sanitaryware reported strong revenue growth in Q1 FY27, while lower operating margins weighed on profitability, leading to a marginal decline in net profit during the quarter.

Cera Sanitaryware Q1 Result FY27: Cera Sanitaryware reported Q1 FY27 revenue of ₹486 crore, up 19.46% YoY, while net profit declined 2.62% to ₹45 crore. EBITDA margin fell to 10.13% as operating margins came under pressure despite healthy growth in the company's top line.
Cera Sanitaryware Q1 Result FY27: On 7 August 2026, Cera Sanitaryware announced its financial results for the first quarter ended 30 June 2026. Revenue from Operations increased by 19.46% YoY to ₹486 crore, up from ₹407 crore in Q1 FY26.
While Profit After Tax (PAT) decreased 2.62% YoY to ₹45 crore compared with ₹47 crore in Q1 FY26. EBITDA Margin stood at 10.13% during the quarter.
Cera Sanitaryware share price is trading 3.98% lower on 7 August 2026 at the time of writing this article. The stock has delivered 16% returns year-to-date and -3% returns over the one year from 7 August 2025 to 7 August 2026.
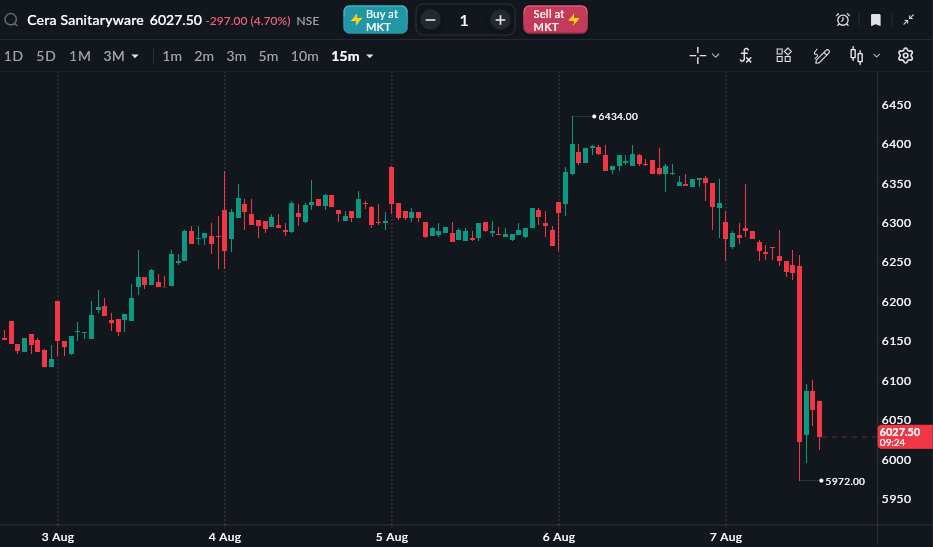
As of 7 Aug, 12:50 PM
READ THIS ALSO: Hero MotoCorp Q1 Results 2027
Cera Sanitaryware Q1 FY27 Results Highlights
-
Revenue from Operations stood at ₹485.98 crore, registering a 19.46% YoY increase from ₹406.80 crore in Q1 FY26. Compared with ₹623.99 crore in Q4 FY26, revenue decreased 22.12% QoQ.
-
Total Revenue stood at ₹507.26 crore, registering a 19.24% YoY increase from ₹425.40 crore in Q1 FY26. Compared with ₹630.27 crore in Q4 FY26, total revenue decreased 19.52% QoQ.
-
EBITDA (Excluding Other Income) stood at ₹49.21 crore, compared with ₹53.06 crore in Q1 FY26, registering a 7.26% YoY decrease. Compared with ₹97.92 crore in Q4 FY26, EBITDA decreased 49.74% QoQ.
-
EBITDA Margin stood at 10.13%, compared with 13.04% in Q1 FY26 and 15.69% in Q4 FY26, declining by 2.92 percentage points YoY and 5.57 percentage points QoQ.
-
Profit After Tax (PAT) stood at ₹45.31 crore, compared with ₹46.53 crore in Q1 FY26, registering a 2.62% YoY decrease. Compared with ₹77.33 crore in Q4 FY26, PAT decreased 41.41% QoQ.
-
PAT Margin stood at 9.32%, compared with 11.44% in Q1 FY26 and 12.39% in Q4 FY26, declining by 2.11 percentage points YoY and 3.07 percentage points QoQ.
-
EPS stood at ₹35.13, compared with ₹36.08 in Q1 FY26, registering a 2.63% YoY decrease. Compared with ₹59.96 in Q4 FY26, EPS decreased 41.41% QoQ.
|
Metric |
Q1 FY27 |
Q4 FY26 |
QoQ % |
Q1 FY26 |
YoY % |
|---|---|---|---|---|---|
|
Revenue from Operations (₹ Cr) |
485.98 |
623.99 |
-22.12% |
406.80 |
19.46% |
|
Total Revenue (₹ Cr) |
507.26 |
630.27 |
-19.52% |
425.40 |
19.24% |
|
EBITDA (₹ Cr) |
49.21 |
97.92 |
-49.74% |
53.06 |
-7.26% |
|
EBITDA Margin |
10.13% |
15.69% |
-5.57 ppt |
13.04% |
-2.92 pp |
|
PAT (₹ Cr) |
45.31 |
77.33 |
-41.41% |
46.53 |
-2.62% |
|
PAT Margin |
9.32% |
12.39% |
-3.07 ppt |
11.44% |
-2.11 pp |
|
EPS (₹) |
35.13 |
59.96 |
-41.41% |
36.08 |
-2.63% |
Source: Company Filing
All topics
Click the link, confirm the box next to sahi.com is checked — ignore any other results.