
Bollinger Bands Scalping: Squeeze Breakouts and Mean Reversion Setups
Two setups, one framework — how to trade Bollinger Bands on Nifty and Bank Nifty based on what the market is actually doing
Bollinger Bands scalping uses two setups on Indian index charts. The BB Squeeze Breakout enters when tight band compression breaks out with volume expansion, targeting 1–2× the squeeze range. The Mean Reversion setup fades extreme price moves at the outer bands — only in confirmed range-bound conditions — targeting a return to the 20-period middle band. Match your strategy to market conditions: breakout on trend days, mean reversion on flat days.
Part of Sahi's Complete Scalping Guide for Indian Traders | Also read: What Are Bollinger Bands? Beginner's Guide
Bollinger Bands are three lines wrapped around a price chart that tell you whether the market is calm or explosive, the bands squeeze tight when volatility dries up, and explode wide when a big move is underway. Think of them as a spring around the price: the tighter it's sqeezed, the more violently it snaps back.
However, Bollinger Bands have a reputation problem.
Most traders see price touch the upper band and sell. Price touches the lower band and they buy. They lose consistently and conclude that Bollinger Bands do not work. They are half right, because that specific interpretation does not work. But the underlying principle of what Bollinger Bands measure is genuinely useful: they measure volatility. And volatility is the raw material of scalping.
When Bollinger Bands narrow, volatility is contracting. Energy is coiling. The market is building up pressure that will eventually release as a sharp directional move. When bands widen sharply, volatility is expanding and a strong directional move is in progress.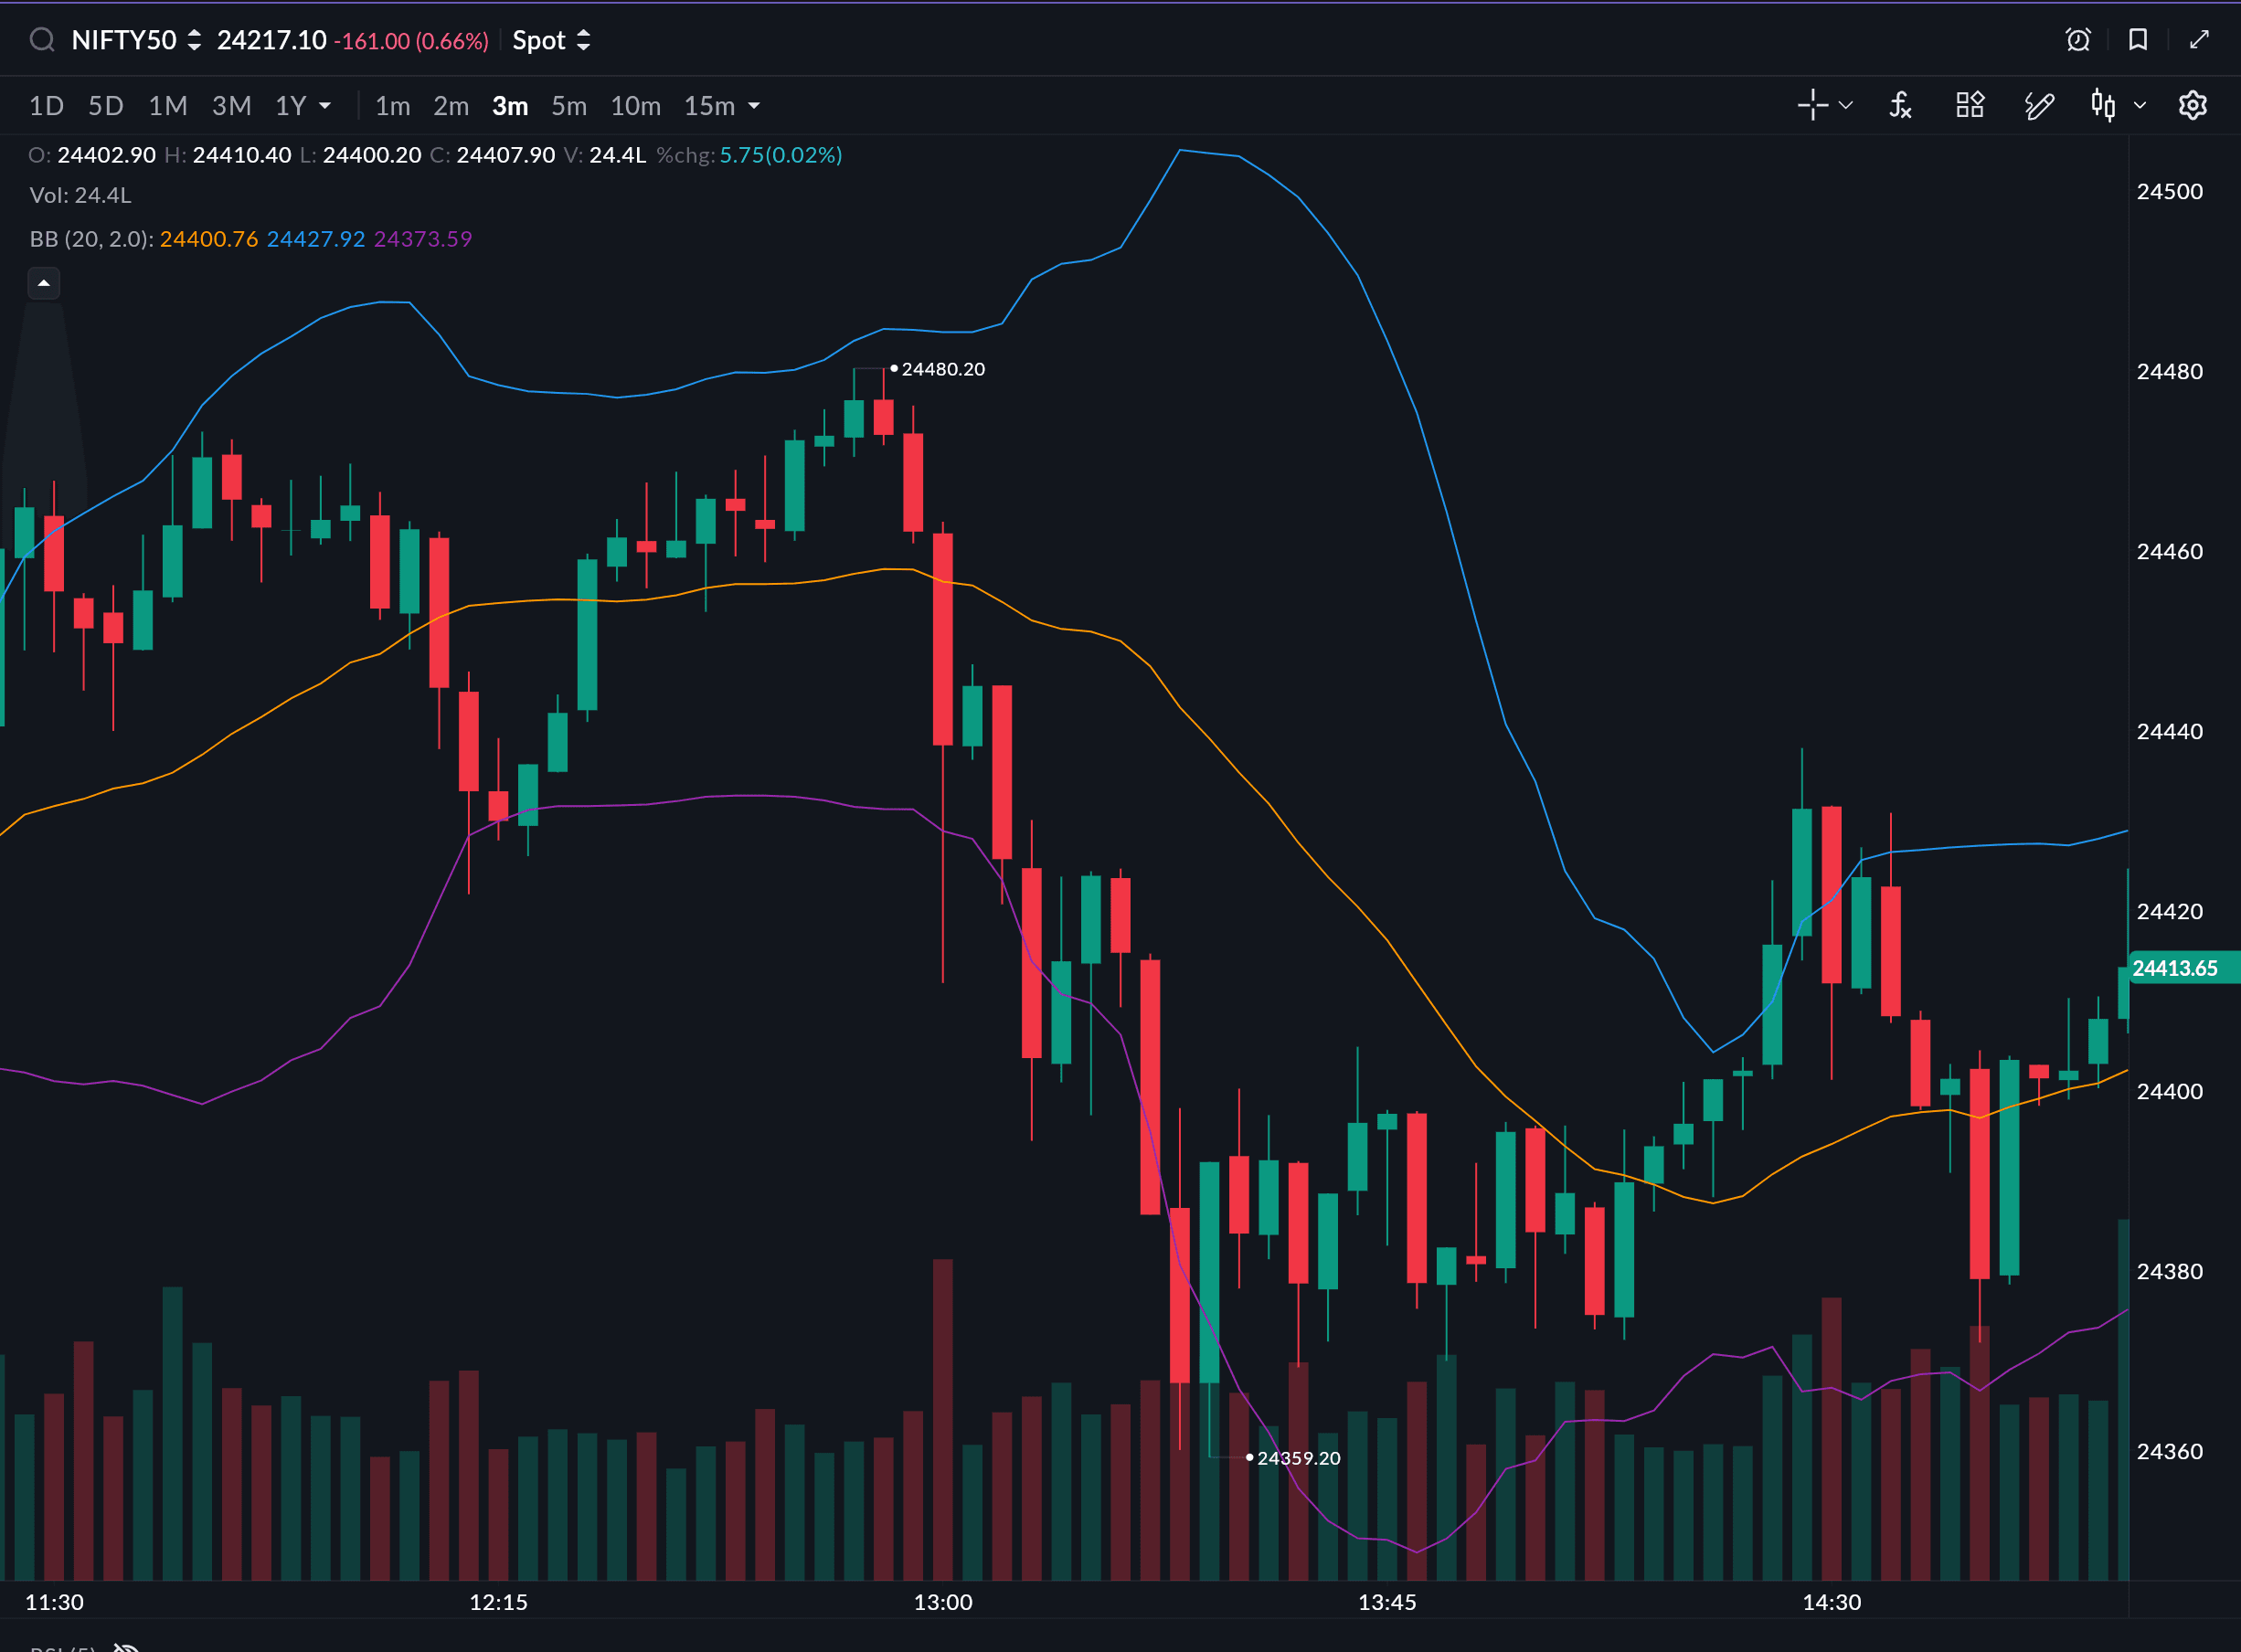
These two states, contraction and expansion are the foundation of both Bollinger Band strategies in this article. The BB Squeeze Breakout trades the transition from contraction to expansion. The Mean Reversion setup uses expansion extremes to find pull-backs to the mean. Together, they cover two different market personalities and give you a strategy for both trending and mean-reverting conditions.
Setting Up Bollinger Bands for Scalping on Sahi
The default Bollinger Band setting: 20-period SMA, 2 standard deviations, which works well for scalping. Do not change the standard deviation multiplier for scalping purposes.
Recommended setup:
- Period: 20
- Standard deviations: 2
- Source: Close price
- Timeframe: 3-min for primary analysis, 5-min as an alternative
Optionally, add a second Bollinger Band layer at 1 standard deviation. This inner band creates a useful zone structure: the space between the 1-SD band and the 2-SD band is where most price action during trends occurs, and the zone between the 1-SD bands on each side is the mean-reversion zone during range-bound conditions.
Understanding the BB Squeeze: What It Is and Why It Matters?
The Bollinger Band Squeeze occurs when the upper and lower bands are closer together than they have been in the recent past, typically measured by comparing the current band width to the band width 6 months (126 trading days) ago on daily charts, or the past 20–30 candles on a 3-min chart.
For scalping purposes, you do not need a formal squeeze indicator. You can visually identify a squeeze on the 3-min chart: the bands become nearly parallel, the price action compresses into a tight range of 30–50 points on Bank Nifty, and volume drops to its lowest levels of the session.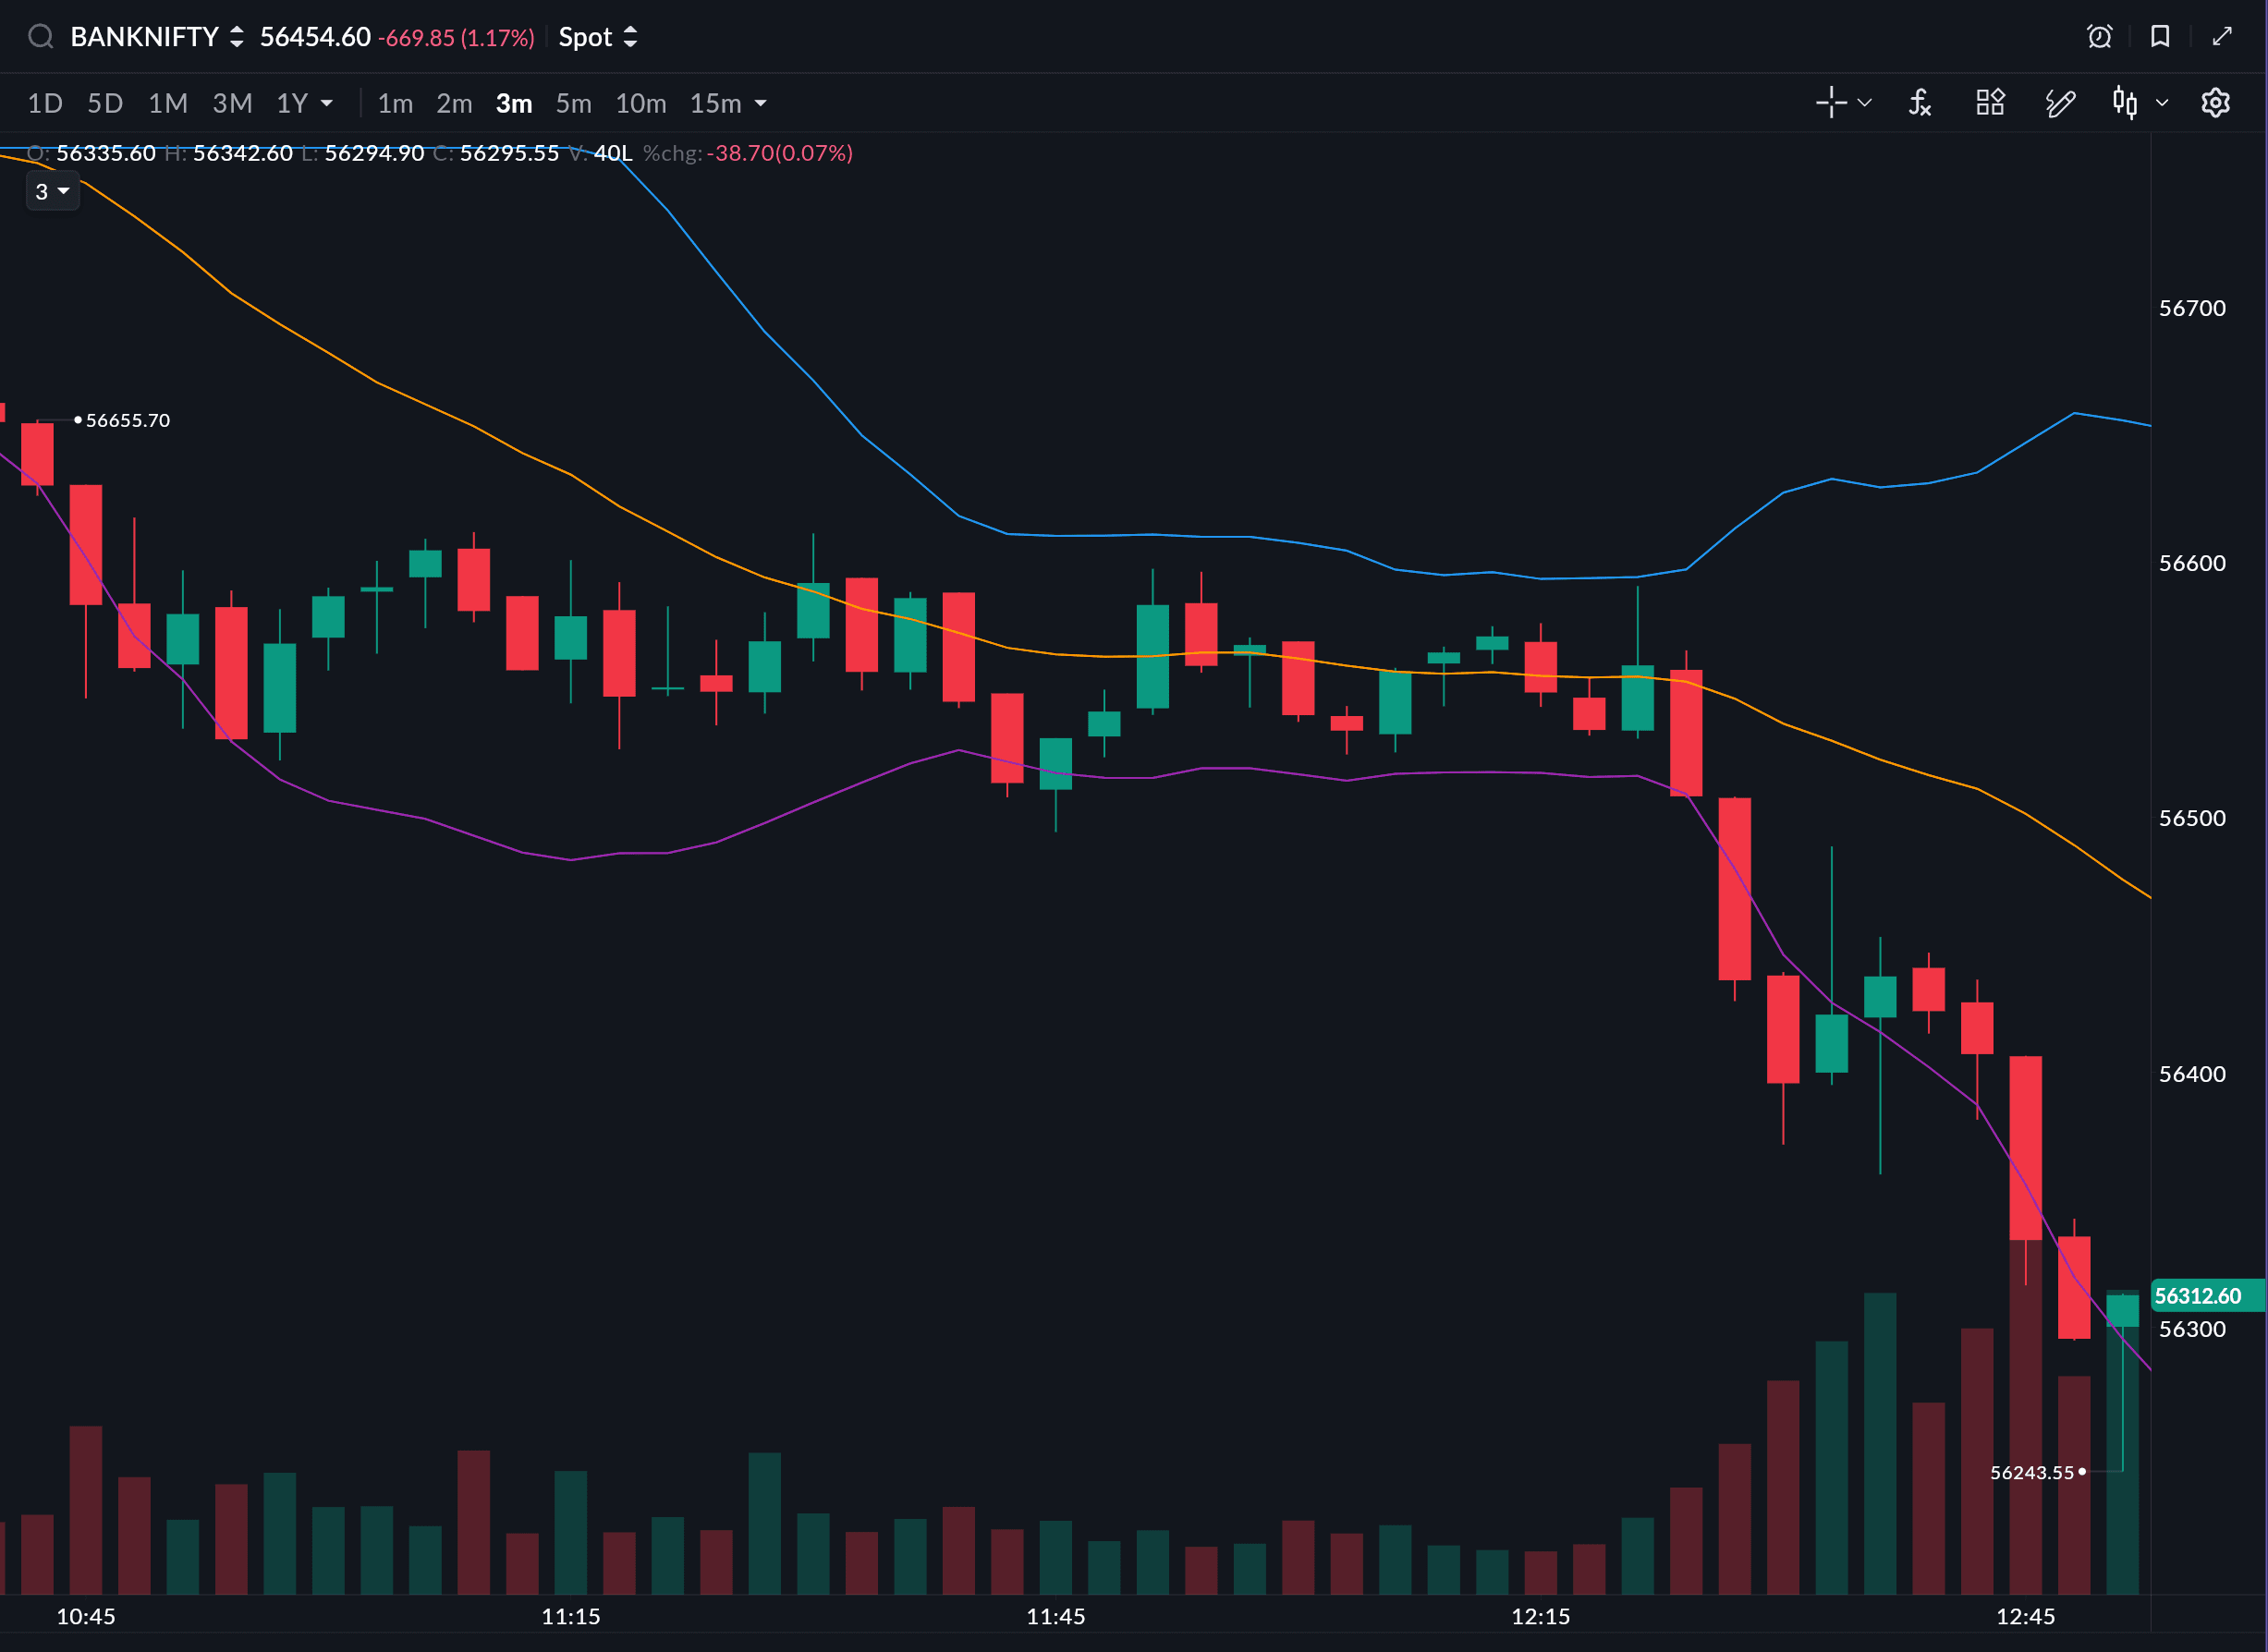
What the squeeze tells you: The market is at a decision point. Buyers and sellers are in near-perfect balance. One side will eventually overwhelm the other, and when that happens, the move can be explosive, often 100–200 points on Bank Nifty within 10–15 minutes.
The squeeze itself does not tell you the direction. The breakout does. This is why you wait for the breakout signal rather than positioning before it.
Strategy 1: BB Squeeze Breakout Setup
How to Identify the Squeeze
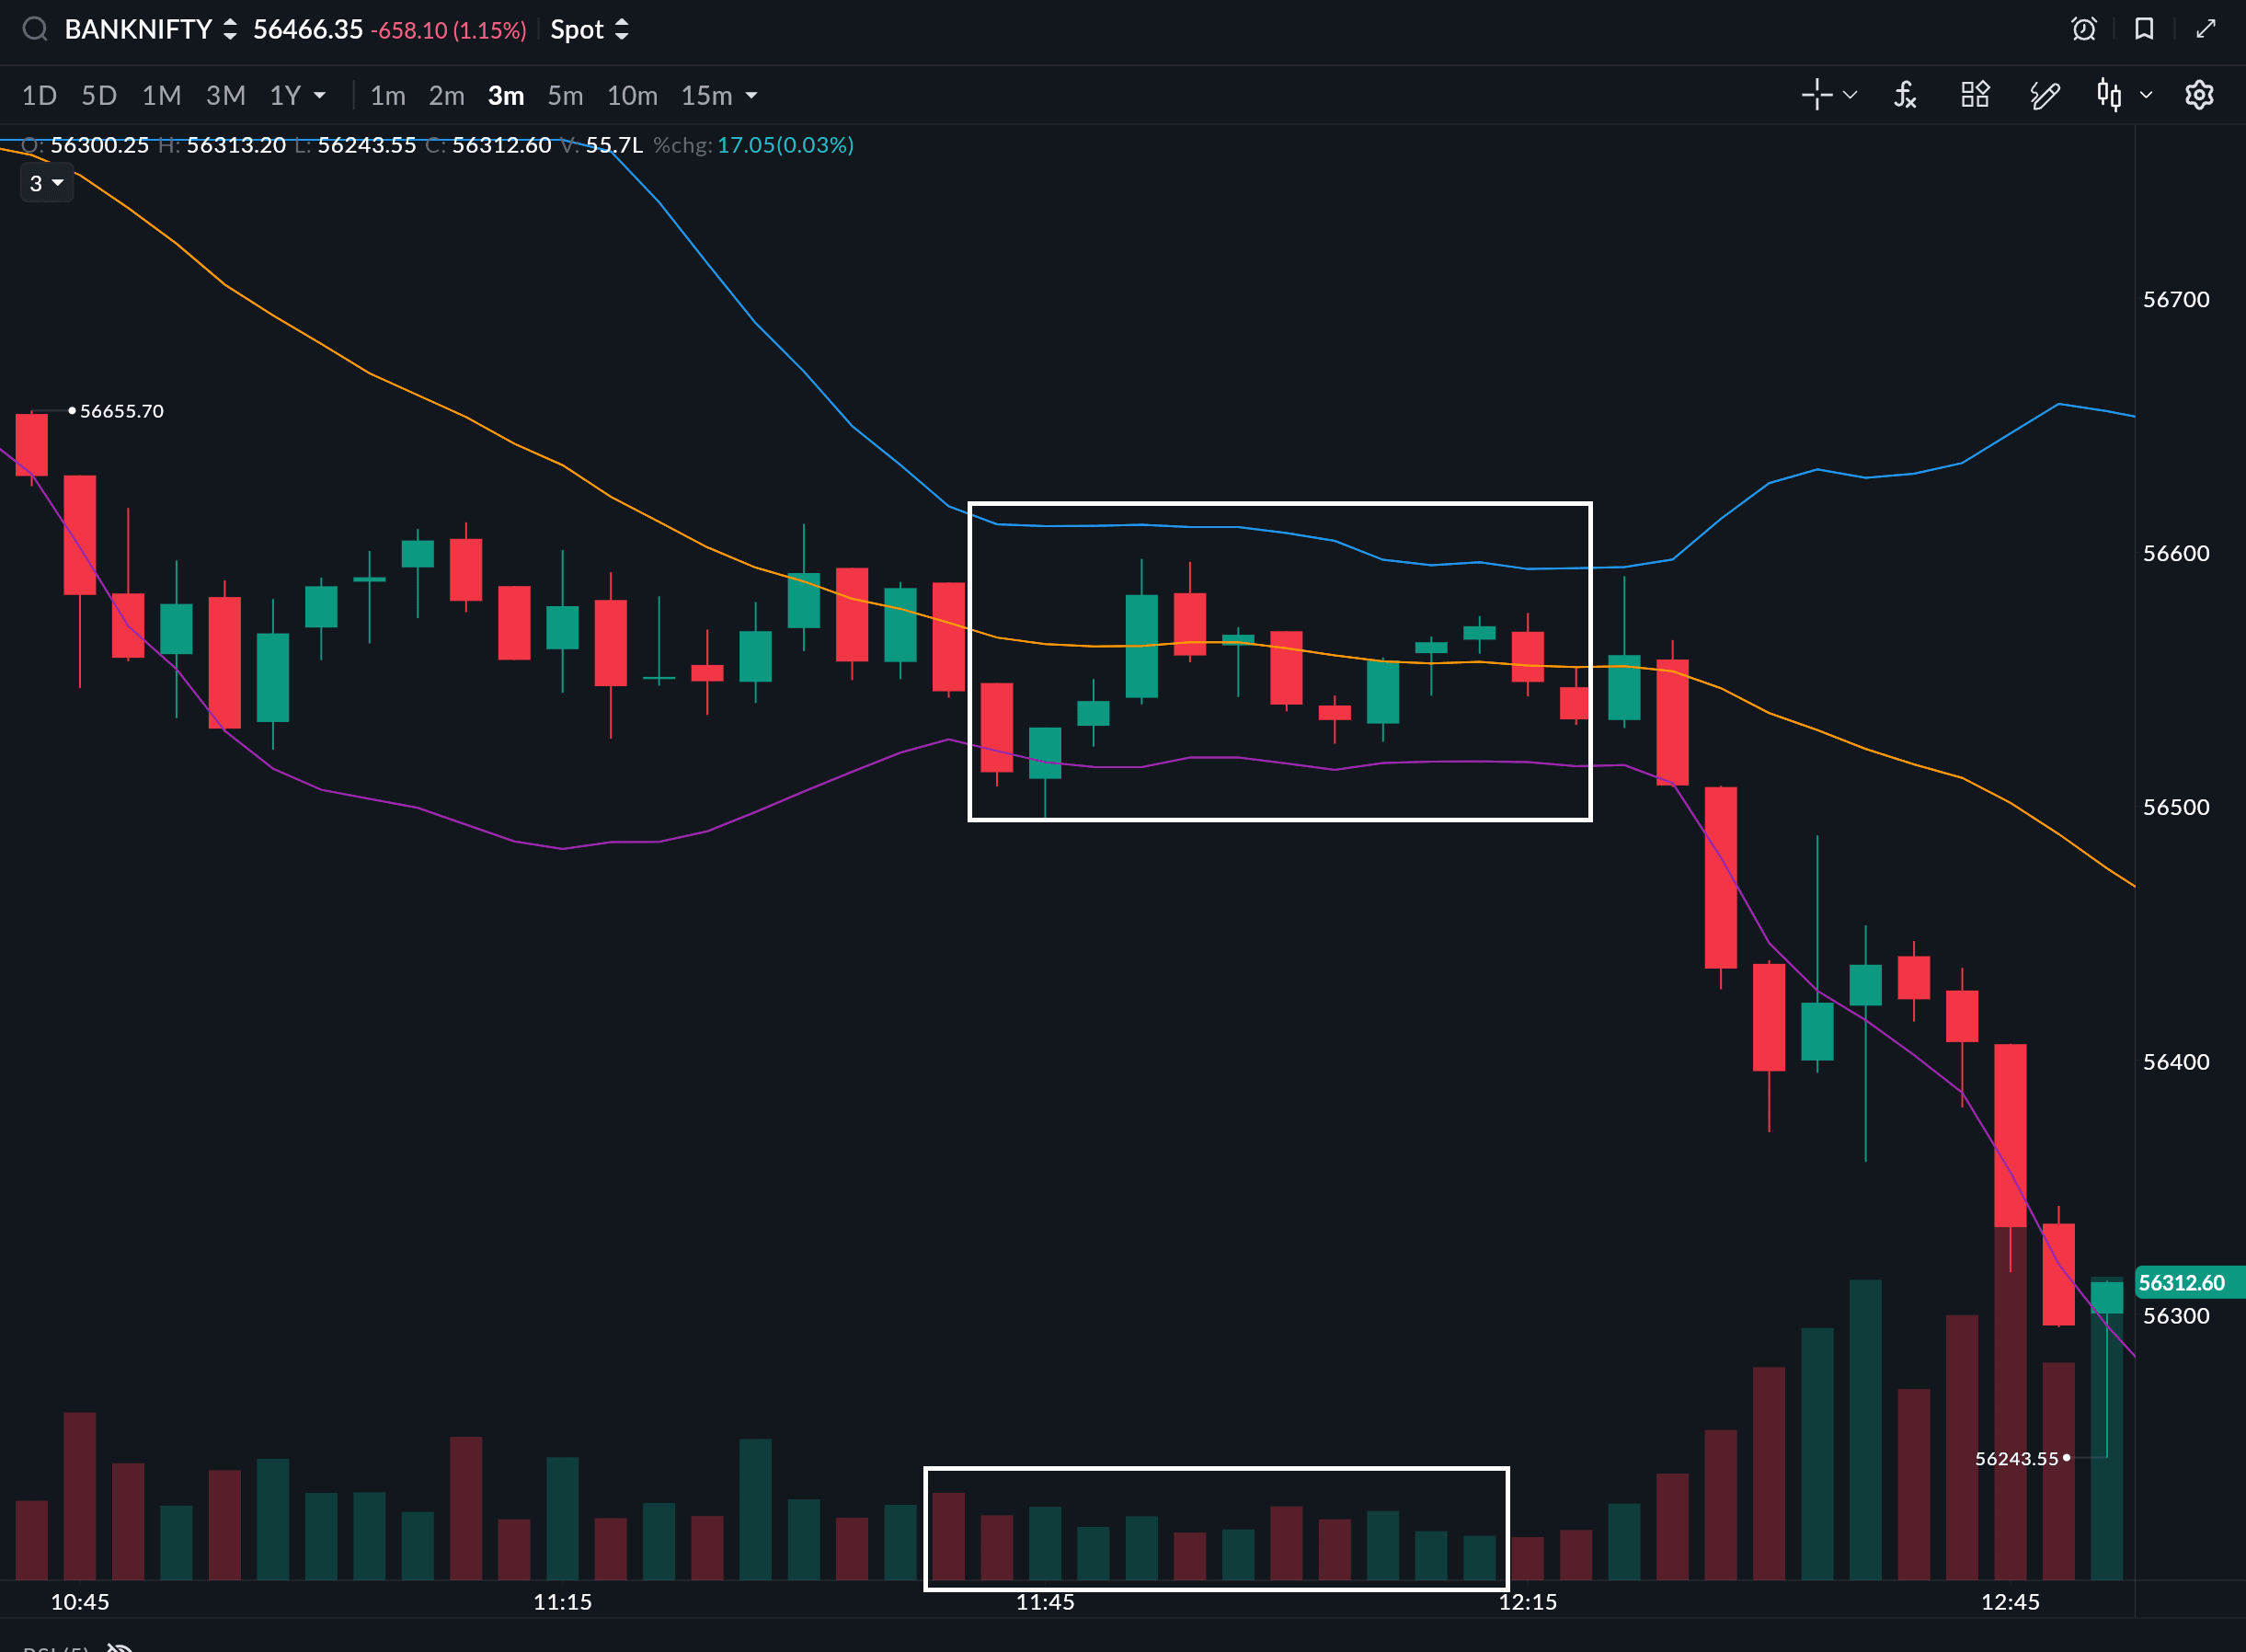
On the 3-min chart, you are looking for:
- Bollinger Bands that are visibly narrower than the surrounding candles' band structure — the squeeze usually looks like the bands are "pinching" together
- At least 5–8 consecutive candles staying within the bands with no closes outside
- Volume declining steadily during the squeeze period — lower volume = more compressed energy
- Price oscillating without clear directional bias within the narrow range
Entry Rule: The Breakout Candle
The entry signal fires when a candle closes outside the Bollinger Band — either above the upper band for a long, or below the lower band for a short.
This close outside the band after a squeeze is fundamentally different from a random close outside the band during normal volatility. During the squeeze, the bands are narrow, so a close outside them with expanding volume is genuinely significant — it means the breakout has real momentum.
Long entry rule: A 3-min candle closes above the upper Bollinger Band after a squeeze period. Volume on the breakout candle is 1.5× or more the average of the squeeze period candles. Enter at the close of the breakout candle.
Short entry rule: A 3-min candle closes below the lower Bollinger Band after a squeeze period. Same volume rule applies. Enter at the close.
Stop-Loss for BB Squeeze Breakout
Place the stop-loss at the middle band (20-period SMA) for aggressive entries. For conservative entries, place it at the opposite edge of the squeeze range — the low of the squeeze period for longs, the high for shorts.
The reasoning: if the breakout is genuine, price should not come back through the centre of the bands after breaking out. A return to the middle band after a breakout suggests the move is failing, and you exit before it turns into a full reversal.
Target for BB Squeeze Breakout
Use a two-part target structure:
- T1: 1× the width of the squeeze range (the distance from the top to the bottom of the squeeze area). Book 50% at T1.
- T2: 2× the squeeze range width, or the next significant support/resistance level on the 15-min chart, whichever is closer.
The logic of using the squeeze range width as a target unit: the coiled energy released during the breakout is proportional to how compressed the range was. A tighter squeeze = more energy = larger initial move.
Additional Confirmation: Direction Bias
Before the breakout happens, look at these factors to get a directional bias:
- Position relative to VWAP: If price during the squeeze is above VWAP, long breakouts are more likely to succeed. Below VWAP — short breakouts.
- 15-min trend: The breakout direction that aligns with the higher-timeframe trend has a significantly higher success rate.
- Pre-market or morning gap direction: If Nifty gapped up at open and the squeeze forms mid-morning, a bullish breakout is more likely than a bearish one.
Strategy 2: Bollinger Band Mean Reversion Scalp
This is the other side of the Bollinger Band story. Mean reversion is based on a statistical fact: price tends to return to its average after an extreme deviation. The Bollinger Bands define those extremes.
The core idea: When price moves sharply and closes outside or at the extreme edge of the Bollinger Band during a non-trending, range-bound market, it has deviated significantly from its mean. A snap-back to the 20-period middle band is the likely next move.
When Mean Reversion Works — And When It Doesn't
This is the most important thing to understand about mean reversion scalping:
Mean reversion only works in range-bound, oscillating market conditions.
In a strongly trending market, price can walk along the upper or lower Bollinger Band for many consecutive candles. If you fade the band touch in a trend, you will be fighting a freight train. This is the most common way traders blow up using Bollinger Bands.
Before attempting any mean reversion scalp, confirm that:
- The 15-min chart shows horizontal price action, no clear staircase structure
- The Bollinger Bands on the 3-min chart are relatively flat and parallel, not expanding in one direction
- The recent price high and low are within 250–350 points on Bank Nifty (confirming a range)
Entry Rules: Mean Reversion Scalp
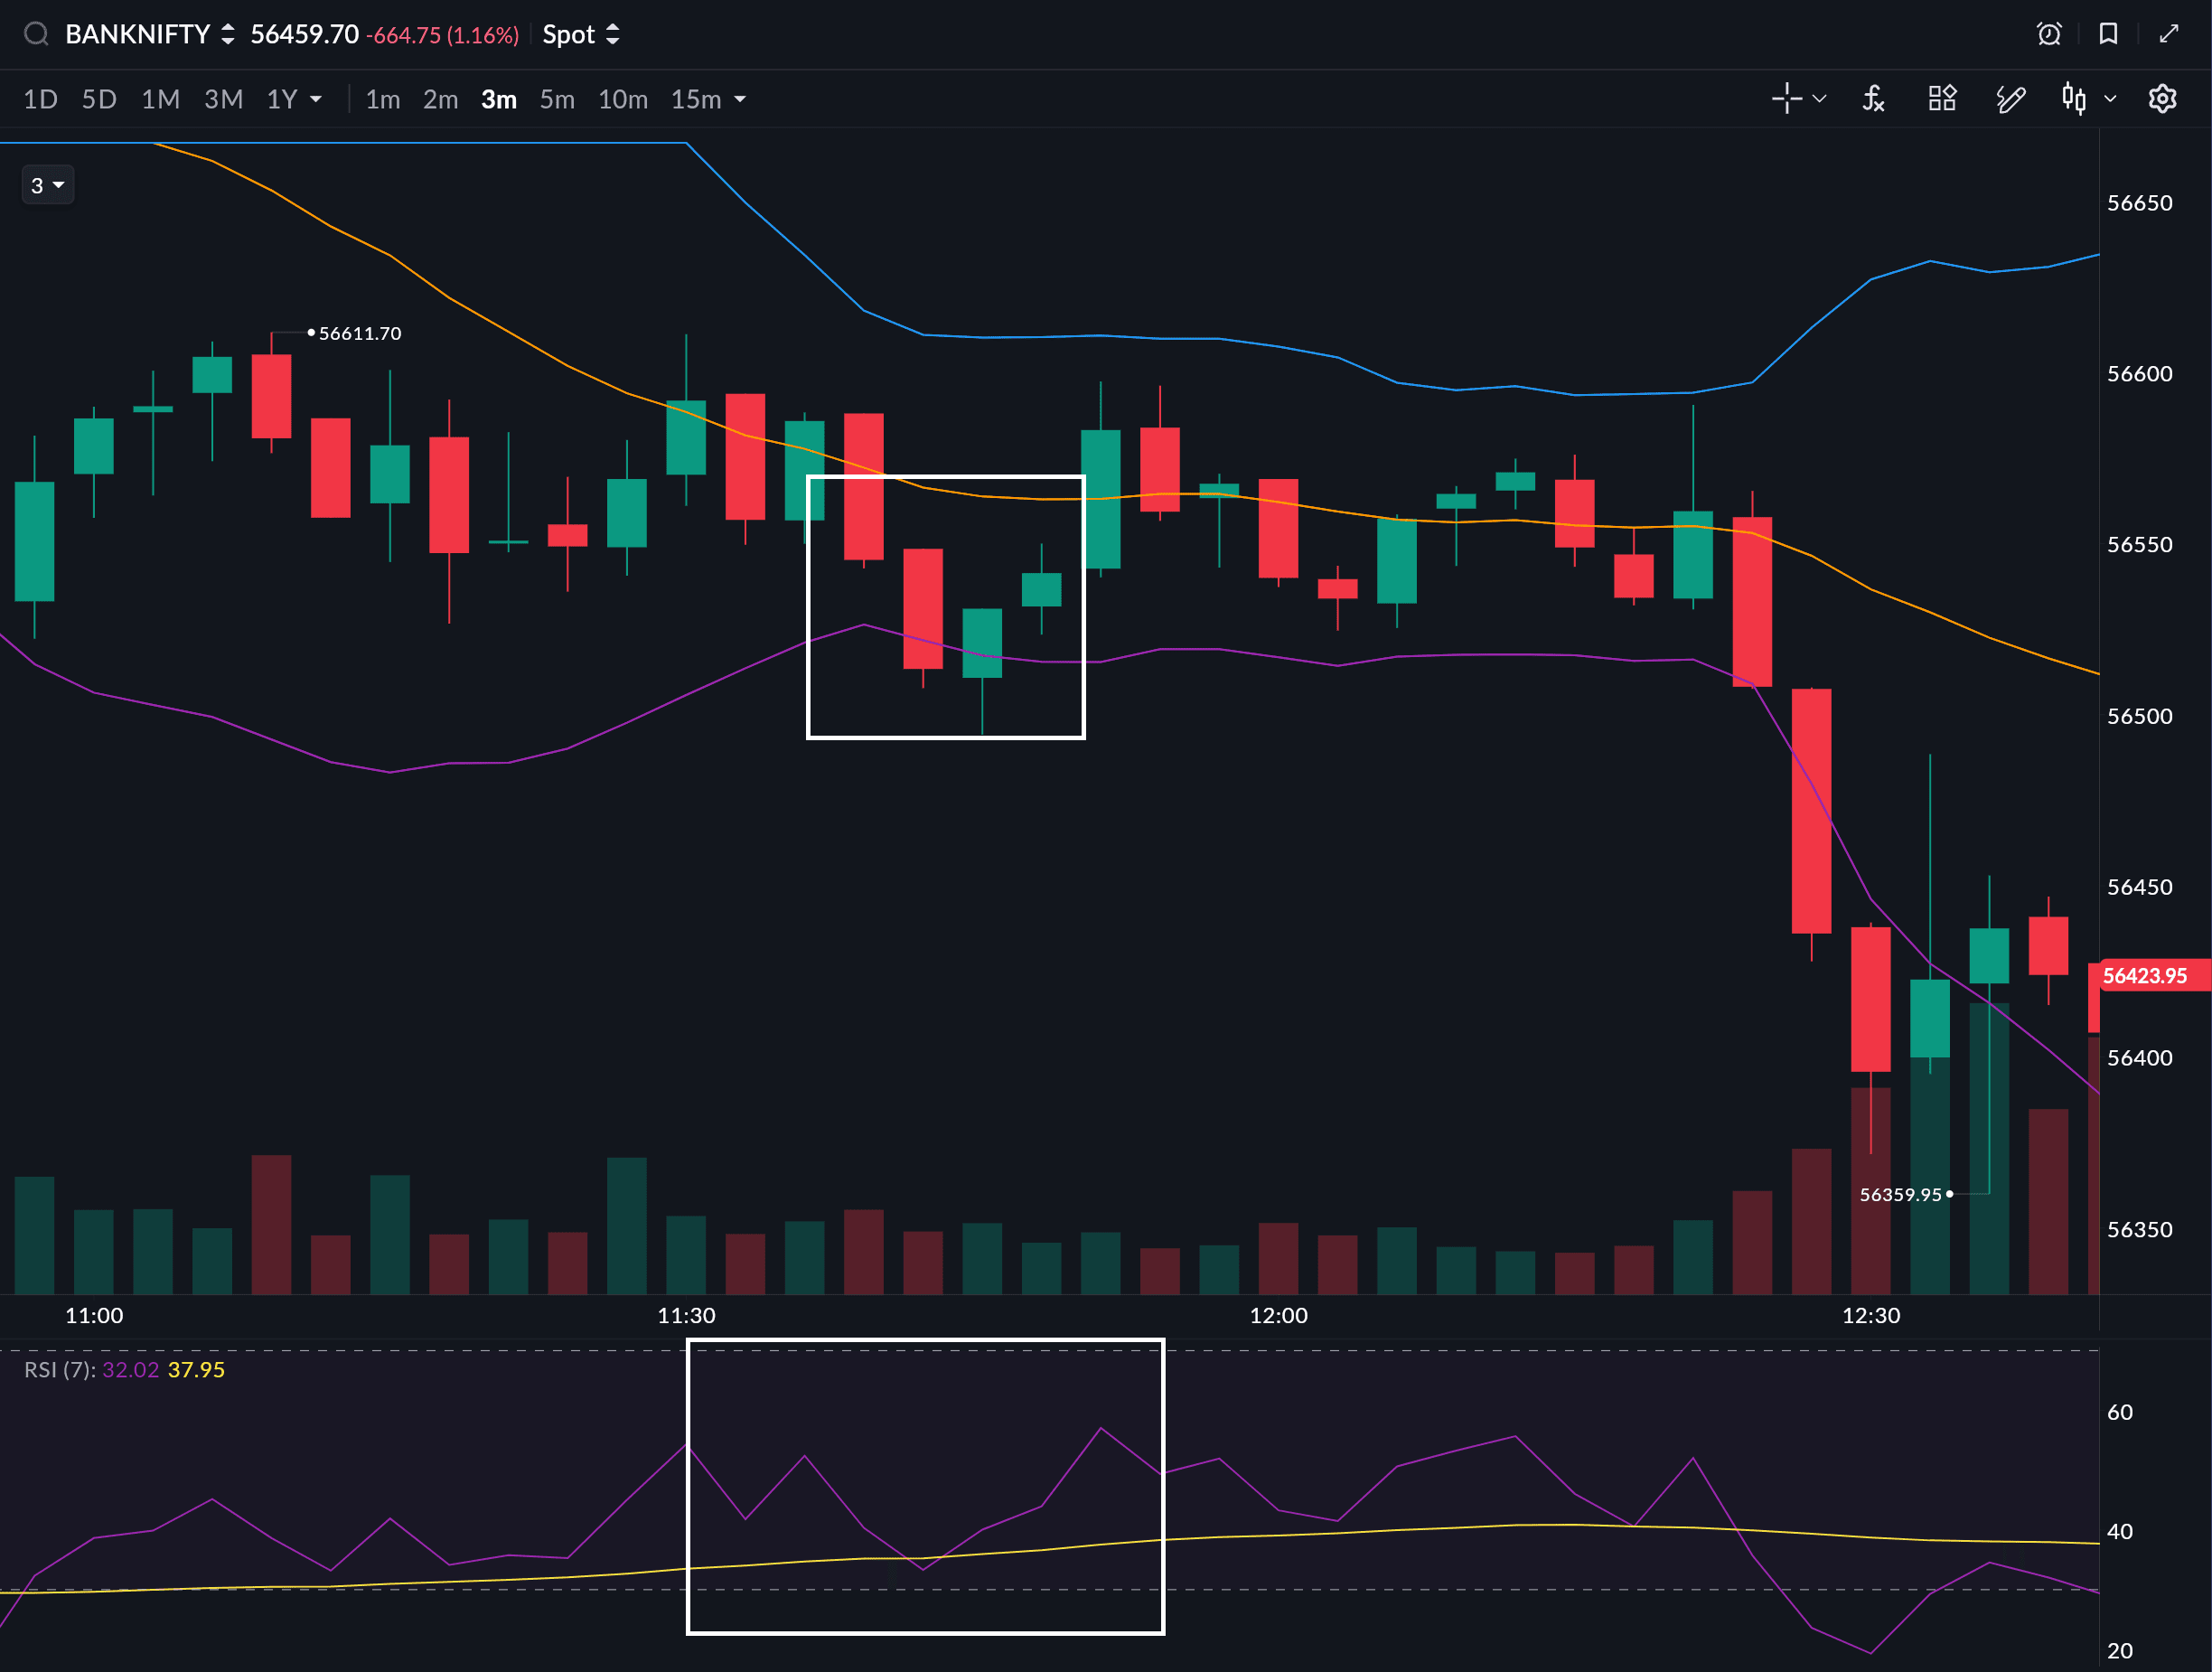
Long setup (fading lower band):
- Market confirmed in range-bound conditions (as above)
- A candle closes at or below the lower Bollinger Band
- The next candle opens inside the band or near the lower band and shows early signs of reversal (green body, or a hammer/pin bar pattern)
- RSI(7) is below 35 at the same time — confirming oversold momentum
- Enter on the close of the confirmation candle (the one that shows reversal signs), not the band-touch candle itself
Short setup (fading upper band):
- Market confirmed in range-bound conditions
- A candle closes at or above the upper Bollinger Band
- The next candle shows reversal signs (red body, or shooting star pattern)
- RSI(7) is above 65 — confirming overbought momentum
- Enter on the close of the confirmation candle
Stop-loss: For long: below the low of the band-touch candle (the candle that closed at or beyond the lower band). For short: above the high of the band-touch candle. The stop is tight because if price continues through the band on the next candle, the range-bound condition is invalidated.
Target: The middle band (20-period SMA). This is the mean. In a range-bound market, price returns to the mean reliably. Do not try to hold for the opposite band — that is two trades in one and introduces additional risk.
The Combined RSI + BB Mean Reversion Signal
RSI divergence combined with a Bollinger Band extreme creates one of the highest-probability scalp setups available on Indian indices. Here is the exact combination:
- Price at or near the lower Bollinger Band AND RSI showing bullish divergence simultaneously
- This means: price is at an extreme deviation from its mean AND momentum exhaustion is signalling a reversal
- Both indicators confirming the same direction dramatically increases the probability of follow-through
For a detailed treatment of RSI divergence, read: RSI Scalping Strategy: Divergence and Momentum on Lower Timeframes
Combining Both Strategies: How to Choose on Any Given Day
The choice between BB Squeeze Breakout and Mean Reversion is not arbitrary. The market tells you which strategy is appropriate:
Use BB Squeeze Breakout when:
- The 15-min chart is trending — clear staircase structure
- The bands on the 3-min chart have been narrowing for at least 15–20 minutes
- A catalyst is expected or has just occurred (economic data release, RBI statement)
- The squeeze has lasted longer than usual — the longer the compression, the more explosive the breakout
Use Mean Reversion when:
- The 15-min chart is flat — horizontal movement with no directional bias
- Bollinger Bands on 3-min are flat and parallel, not expanding
- The market has already had its main trending move for the day (common after 11:00 AM)
- India VIX is low (below 14) — low volatility environments favour mean reversion
Key Takeaways
- Bollinger Bands measure volatility. Use the contraction-expansion cycle, not just overbought/oversold levels.
- BB Squeeze Breakout: identify tight band compression, wait for a candle close outside the band with volume expansion, enter with a stop at the middle band.
- Mean Reversion: only trade in confirmed range-bound conditions. Fade band extremes with RSI confirmation, targeting the middle band.
- Match your strategy to market conditions — trend days get breakout trades, range days get mean reversion trades.
- The %B indicator gives mechanical precision to band-touch entries.