
RSI Scalping Strategy: Using Divergence and Momentum on Lower Timeframes
How to use RSI divergence, failure swings, and the 50-line crossover to scalp Nifty and Bank Nifty with exact entry, stop, and target rules.
RSI scalping uses a shortened RSI(7) on 3-min charts and RSI(5) on 1-min charts to read divergence, failure swings, and 50-line momentum crossovers on Nifty and Bank Nifty. Bullish divergence — price making a lower low while RSI makes a higher low — signals a long entry after a confirming momentum candle, with your stop below the divergence swing. The RSI failure swing (four-step pattern where RSI fails to reach a new extreme) is RSI's most reliable reversal signal. Best scalping windows: 9:30–11:00 AM and 1:00–2:30 PM.
Part of SAHI's Complete Scalping Guide for Indian Traders | Also read: What Is the RSI Indicator? Beginner's Guide
First of all, RSI (Relative Strength Index) is a momentum meter that tells you how fast and how hard a stock or index is moving, on a scale of 0 to 100. Think of it as a speedometer for price: when it reads above 70, the market is running too hot and may be due for a cooldown; when it drops below 30, it's oversold and a bounce could be around the corner.The standard RSI explanation will tell you: above 70 is overbought, below 30 is oversold, sell when it hits 70, buy when it hits 30.
That instruction is dangerously incomplete for scalping.
In a strong trend, RSI can sit above 70 for almost 30 to 40 consecutive candles on a 1-min chart, and buying every time it drops from 70 will wipe out your account. Conversely, in a weak, choppy market, RSI oscillates constantly between 40 and 60 and generates no useful signal at all.
The traders who use RSI profitably for scalping on Indian indices do three things differently: they shorten the period to make it more responsive, they read divergence between RSI and price rather than absolute levels, and they layer momentum filters to separate high-probability entries from noise. This article teaches you exactly that system.
Why Shorten the RSI Period for Scalping
The standard RSI setting is period 14, developed by J. Welles Wilder for daily charts in his 1978 book New Concepts in Technical Trading Systems. On a 3-min chart, a 14-period RSI is so slow it is essentially useless for scalping. It barely registers moves that have already completed by the time the RSI has turned.
For scalping on 3-min charts, use RSI(7). For 1-min charts, use RSI(5). These shortened periods make the indicator reactive enough to respond to the quick momentum shifts that create scalping opportunities.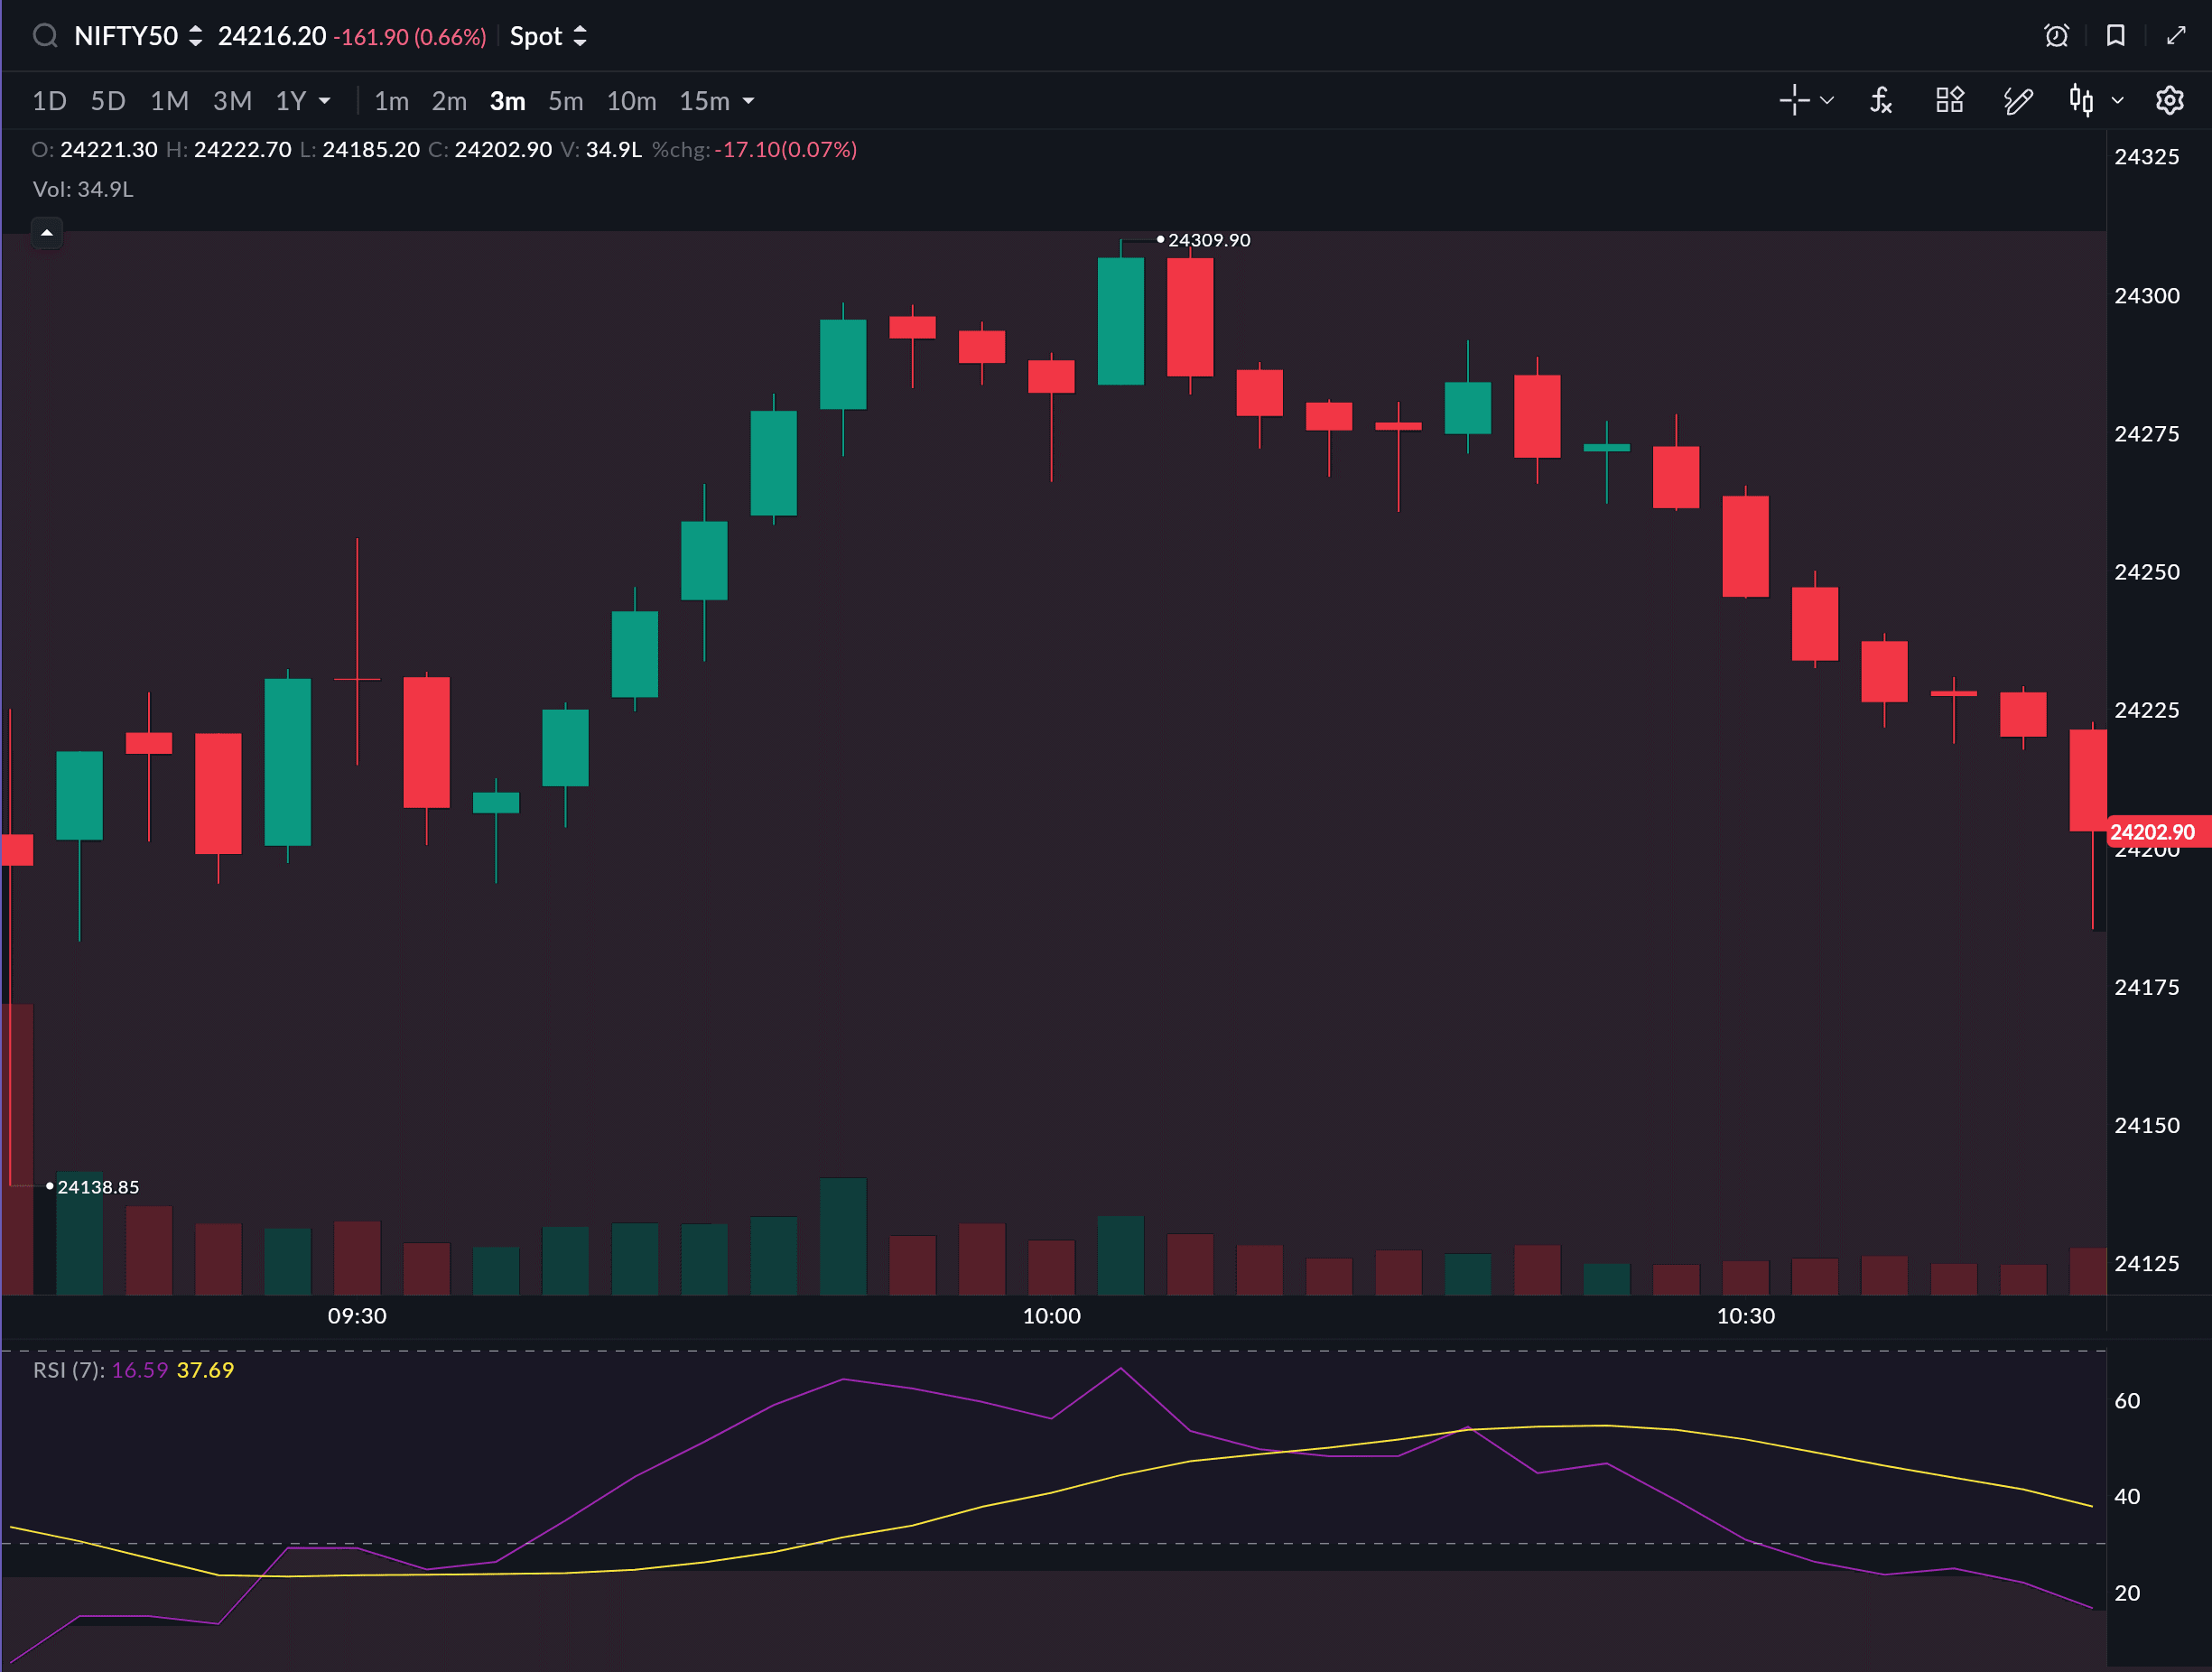
The trade-off is that a shorter RSI produces more noise. RSI(5) will hit 80 and 20 frequently on a 1-min chart. That is fine — because you are not using absolute RSI levels as signals. You are using divergence and the 50-line crossover, both of which are less susceptible to noise even at shorter periods.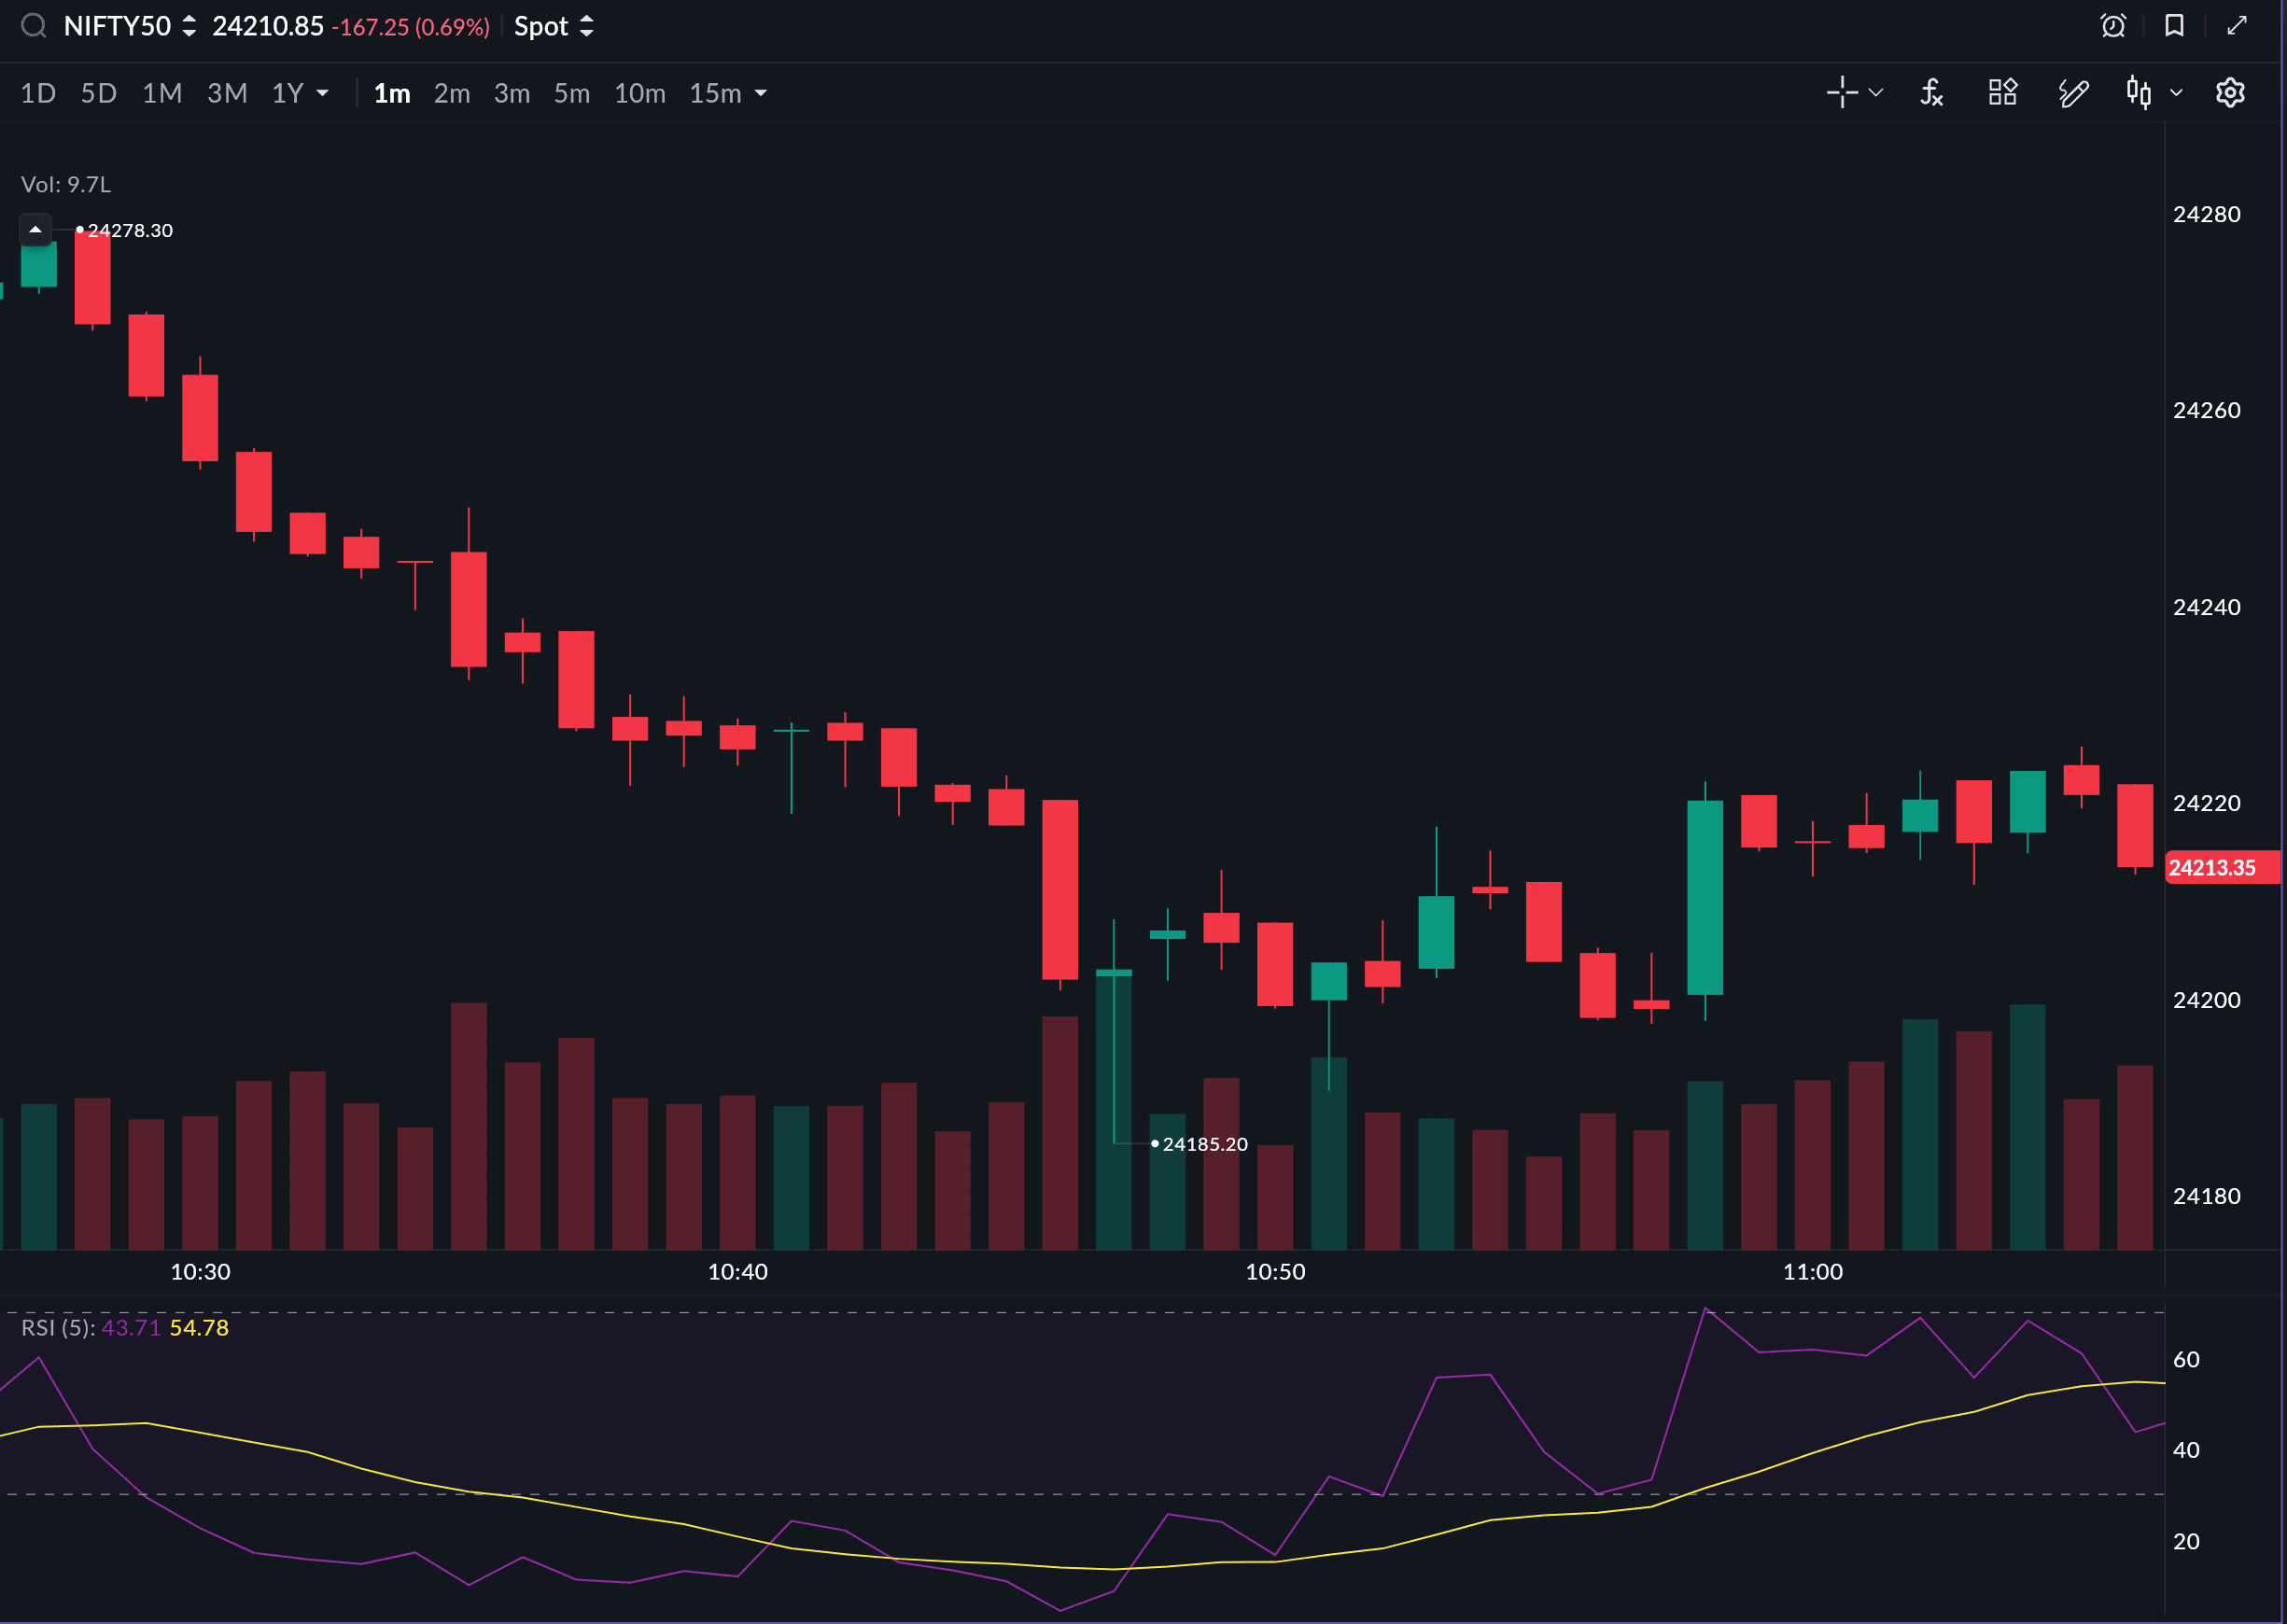
Why not go shorter than RSI(5)? At RSI(3) or RSI(4), the indicator becomes so sensitive that divergence patterns lose their meaning — you will see 5–7 "divergences" per hour that resolve immediately in the trend direction. RSI(5) on 1-min and RSI(7) on 3-min is the sweet spot for Indian index scalping.
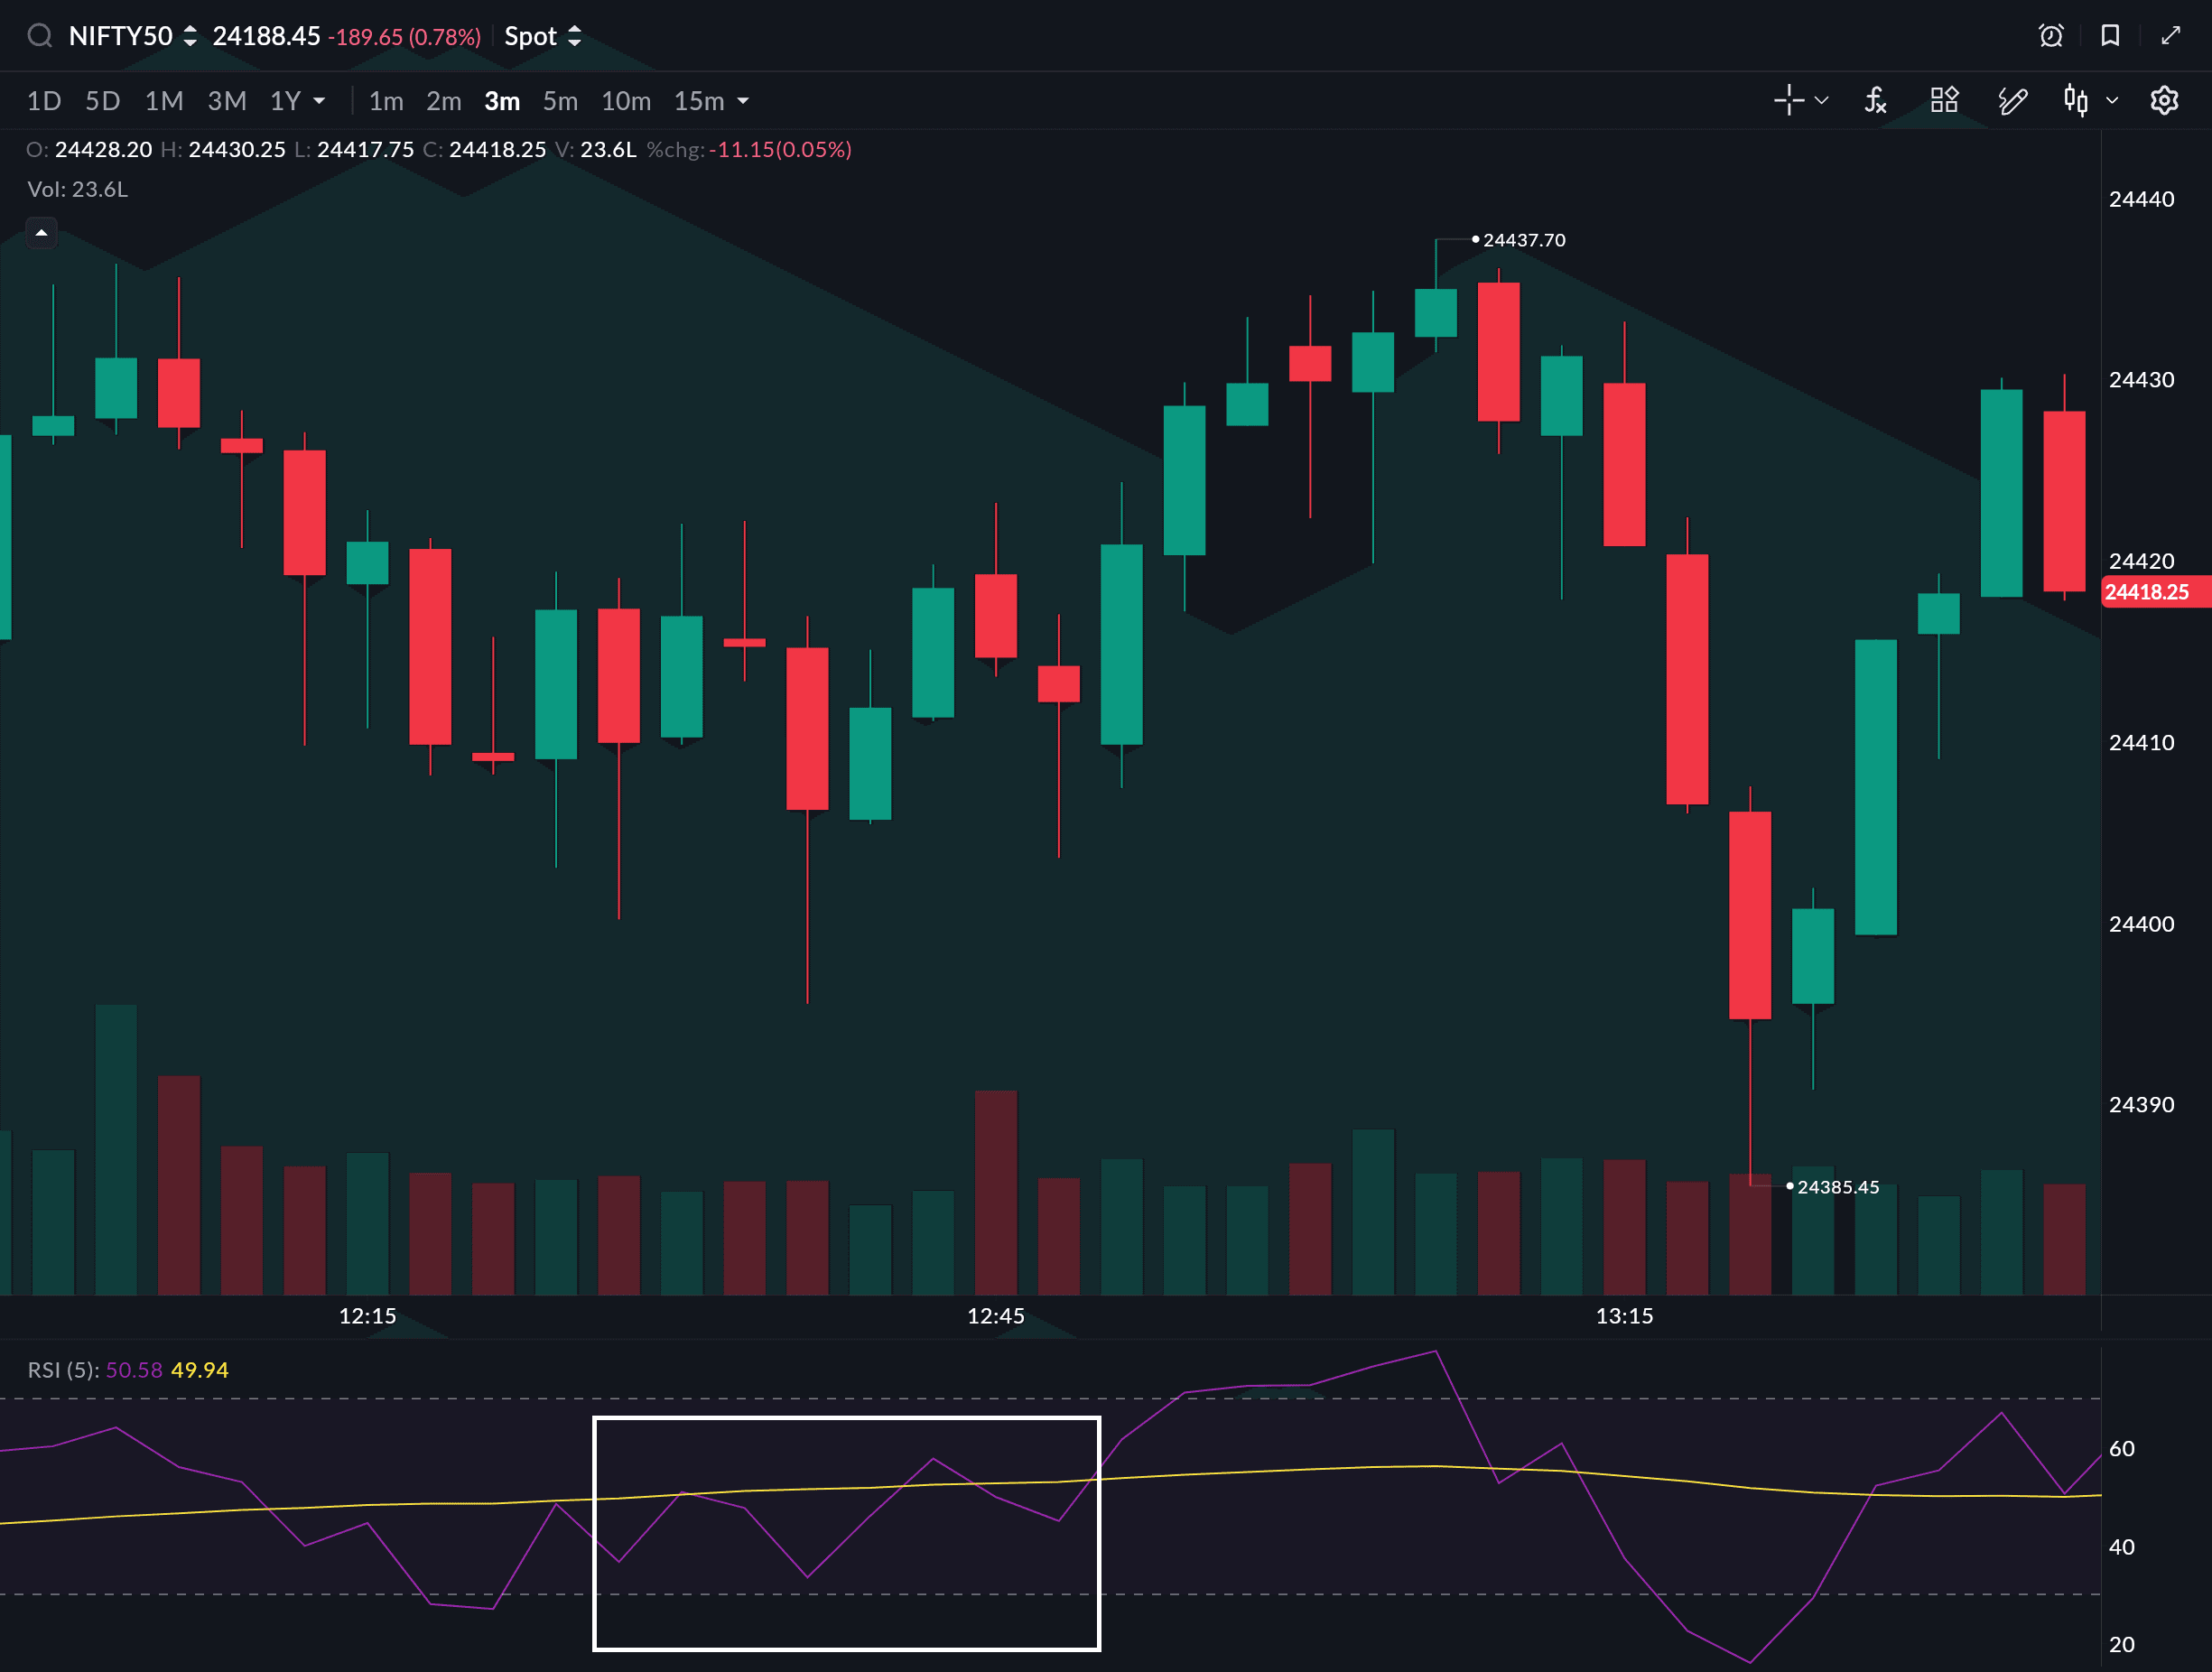
Setting Up RSI Correctly on SAHI Charts
Timeframes: 1-min for fast scalps on Bank Nifty options; 3-min for slightly slower scalp trades on Nifty futures.
RSI configuration:
- Period: 7 (for 3-min) or 5 (for 1-min)
- Source: Close price
- Overbought level: 70
- Oversold level: 30
Add RSI in a separate pane below your price chart. Keep price and RSI visible simultaneously — RSI divergence requires you to look at both at the same time.
Setup 1: RSI Divergence — The Highest Probability Scalp Signal
Divergence is the most powerful RSI signal for scalping because it appears before a reversal rather than after it. Here is exactly what to look for.
Bullish Divergence (Long Setup)
Bullish divergence forms when:
- Price makes a lower low — a new swing low on the chart
- RSI simultaneously makes a higher low — its new low is above the previous RSI low
What this means: price is falling but momentum is weakening. The sellers are losing force. A reversal is building.
The divergence itself is not the entry signal. It is a warning that a reversal is likely. The entry trigger comes next.
Entry trigger for bullish divergence: After identifying the divergence, wait for a green candle to close with its body above the midpoint of the previous red candle. This "momentum candle" confirms that buying has actually started.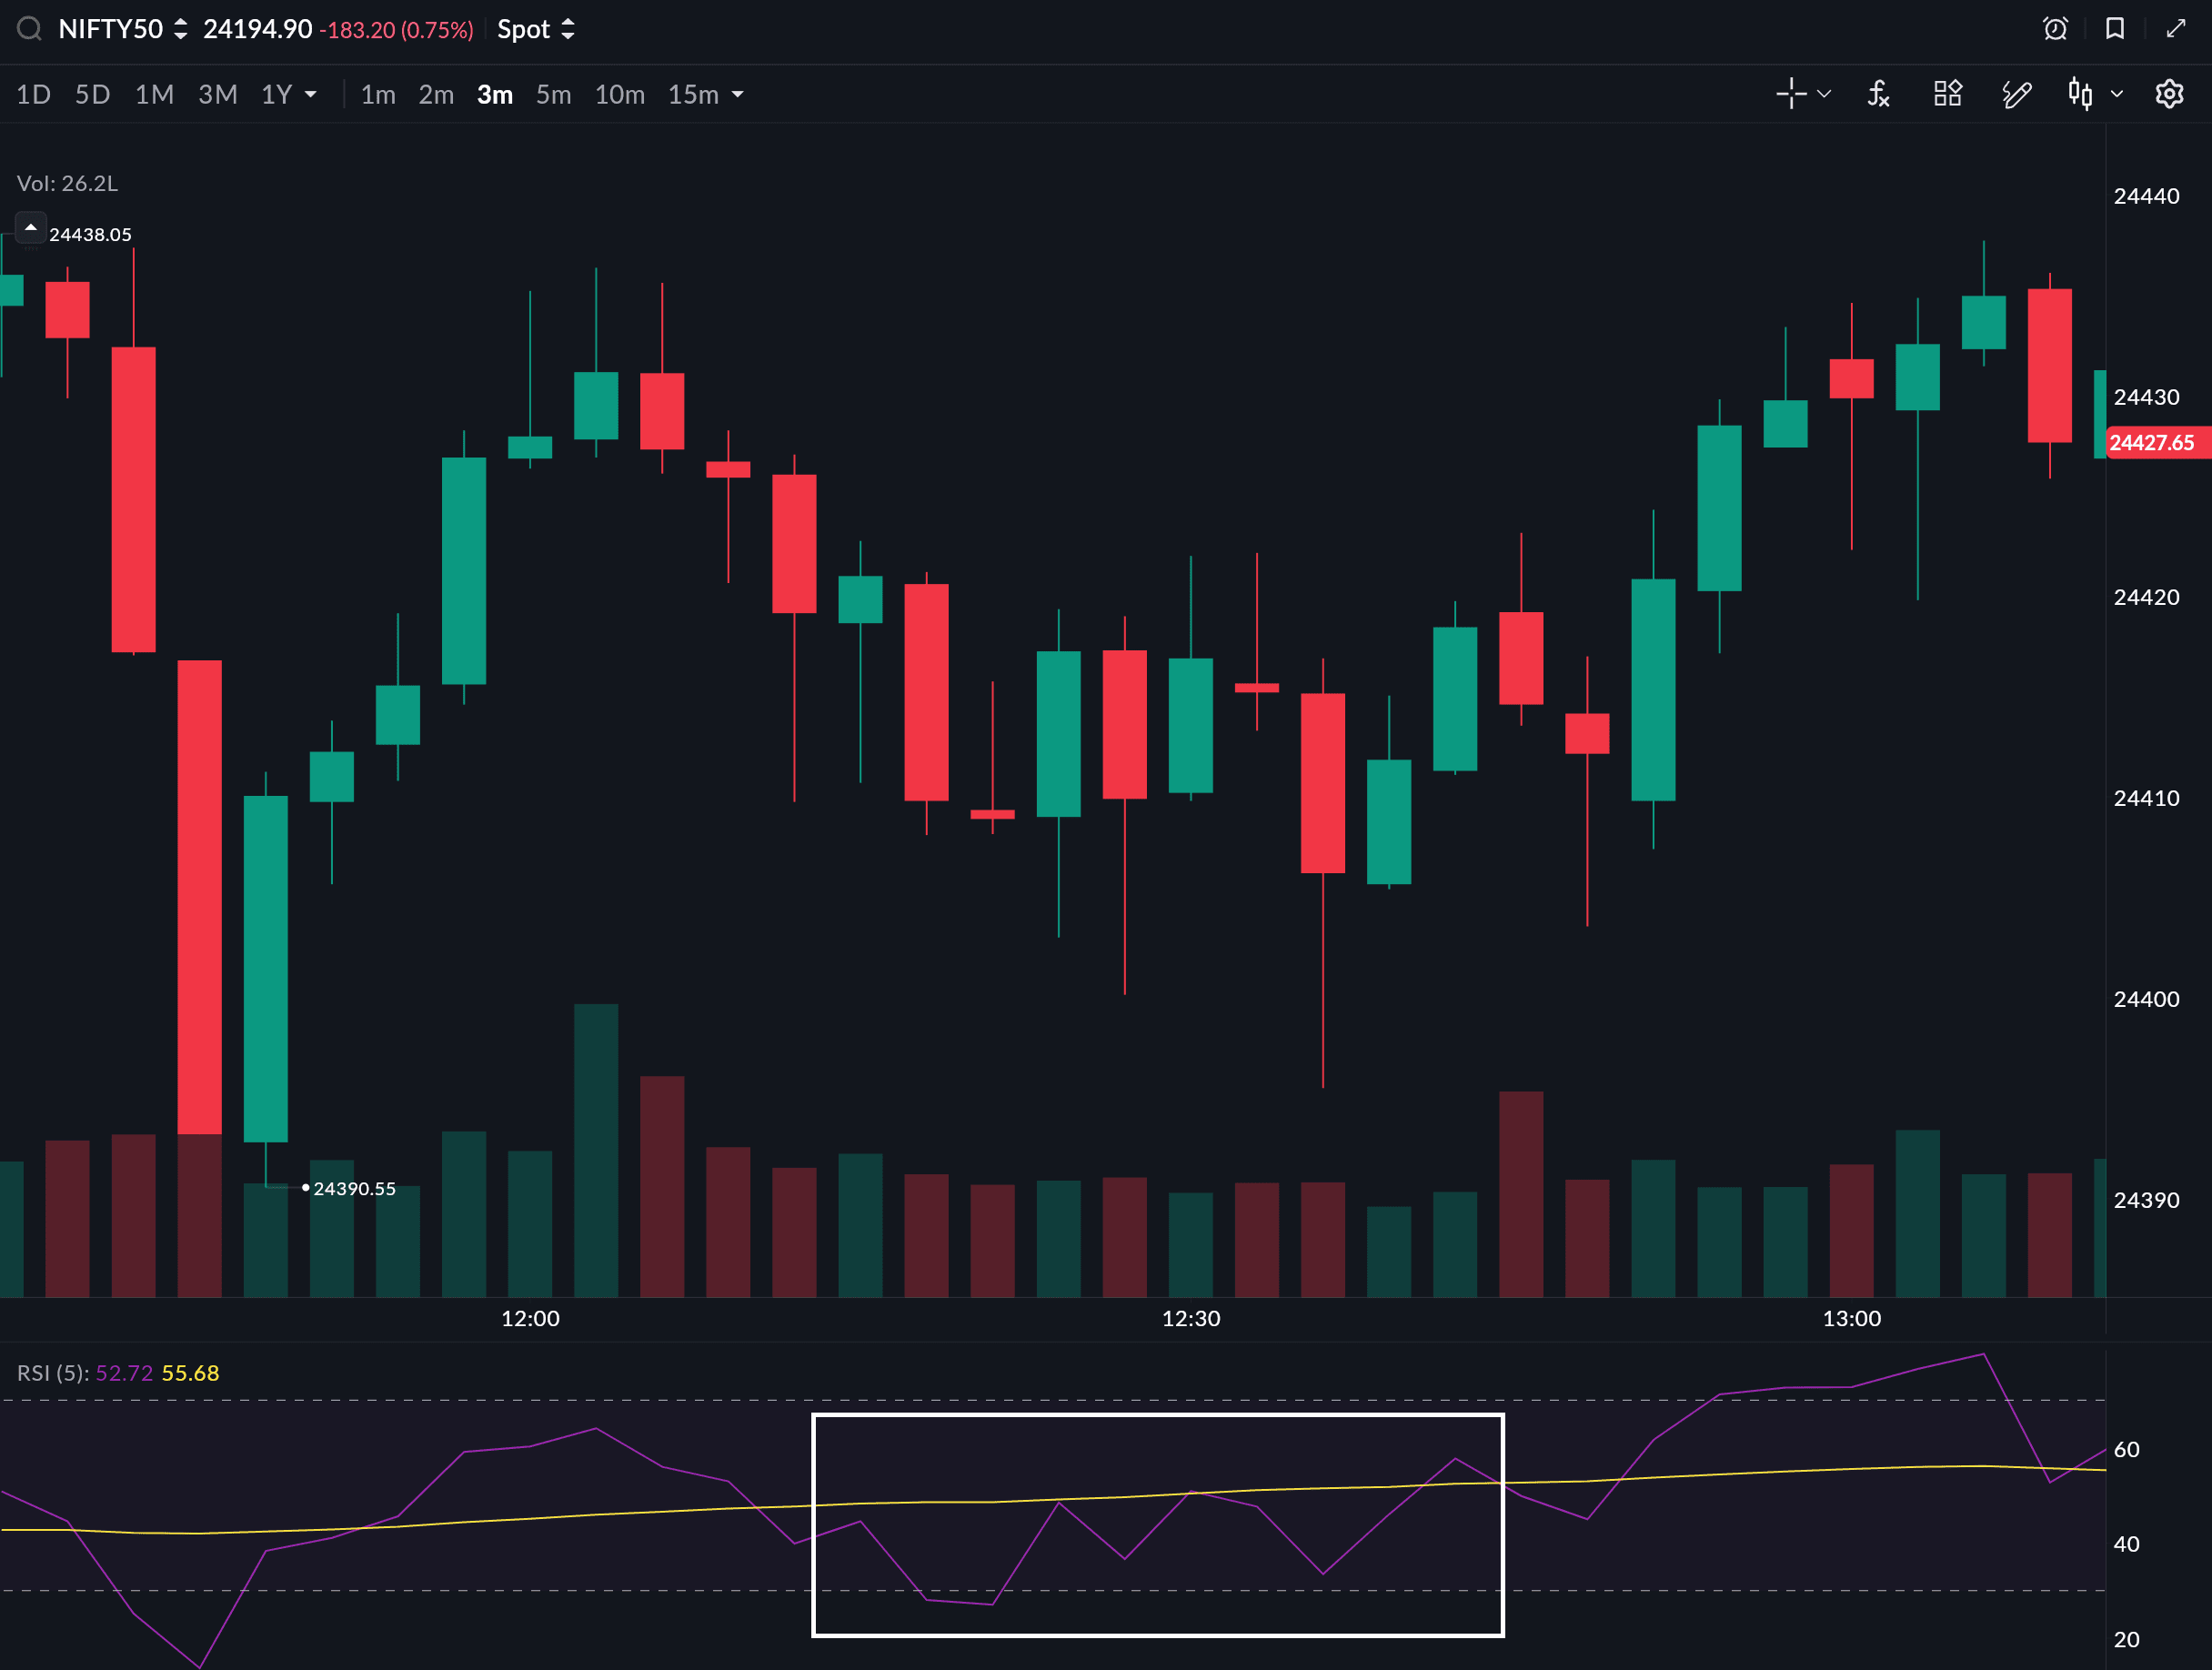
Stop-loss: Below the low of the divergence swing (the price low that formed the second lower low). This level should not be breached if the reversal is genuine.
Target: The previous swing high on the 3-min chart, or 1.5x your initial risk, whichever comes first.
Bearish Divergence (Short Setup)
Bearish divergence forms when:
- Price makes a higher high — a new swing high on the chart
- RSI simultaneously makes a lower high — its new high is below the previous RSI high
What this means: price is rising but buying momentum is fading. The bulls are exhausted. A reversal or sharp pullback is likely.
Entry trigger for bearish divergence: Wait for a red candle to close with its body below the midpoint of the previous green candle.
Stop-loss: Above the high of the divergence swing (the price high that formed the second higher high).
Target: The previous swing low on the 3-min chart, or 1.5x your initial risk, whichever comes first.
Setup 2: RSI 50-Line Crossover — The Momentum Scalp
The 50-line on RSI is the momentum dividing line. When RSI is above 50, momentum is bullish. When it is below 50, momentum is bearish. A crossover of the 50-line is a scalping signal in its own right — especially when it happens with conviction (RSI moving quickly across 50, not drifting).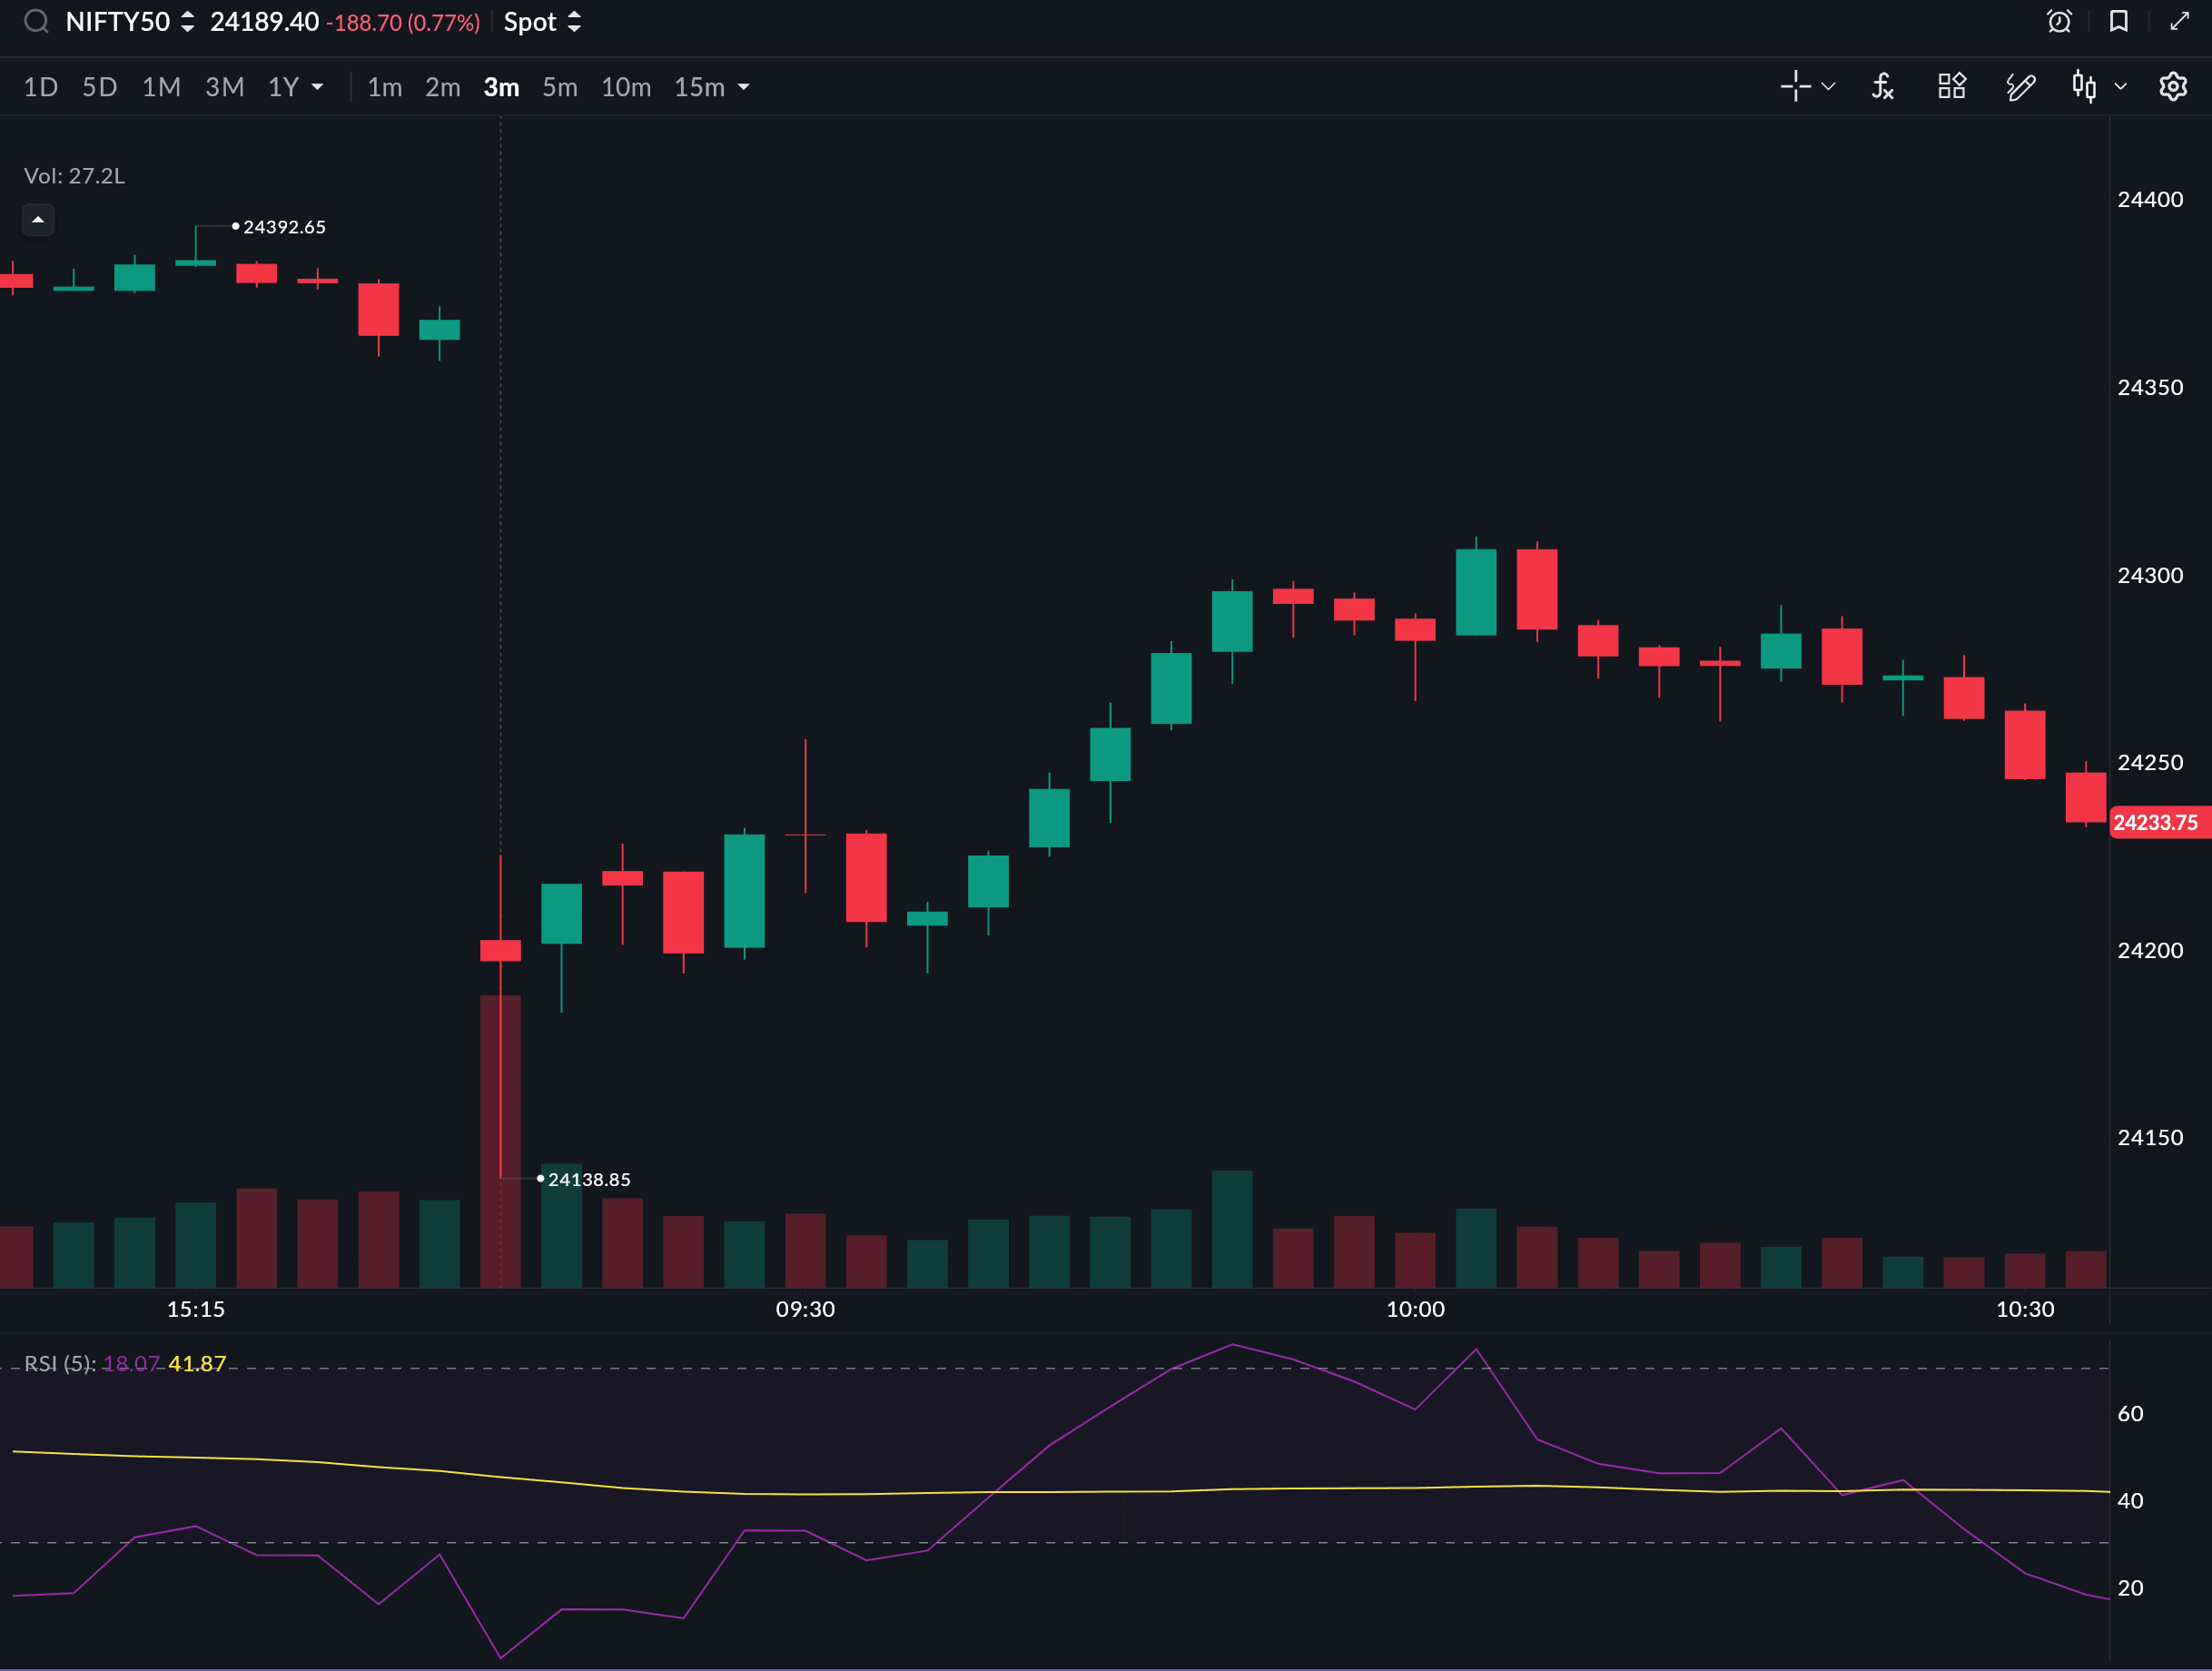
Bullish 50-Line Cross (Long Setup)
- RSI crosses from below 50 to above 50 on the 3-min chart
- The crossing happens quickly — within 1–2 candles — not a slow grind
- Price is simultaneously breaking above a short-term resistance level or the 21 EMA
- Higher-timeframe (15-min) trend is bullish
Entry: At the close of the candle where RSI crosses above 50.
Stop: Below the low of the most recent swing before the crossover.
Target: Next resistance or 1.5x risk.
Bearish 50-Line Cross (Short Setup)
- RSI crosses from above 50 to below 50 on the 3-min chart
- The crossing is fast, not gradual
- Price is breaking below a short-term support level or the 21 EMA
- Higher-timeframe (15-min) trend is bearish
Important: The 50-line crossover signal works best on high-momentum trending days. On range-bound days, RSI oscillates around 50 continuously and this signal becomes unreliable. Identify the day type from the 15-min chart before trading this setup.
Setup 3: RSI Failure Swing — The Expert-Level Reversal Signal
This is the most powerful RSI signal most traders have never heard of. J. Welles Wilder, who created RSI, described the failure swing in New Concepts in Technical Trading Systems (1978) as his preferred reversal signal — prioritised even above divergence.
Bullish Failure Swing (Long Setup)
This forms in four specific steps on the RSI:
- RSI falls below 30 (oversold territory)
- RSI bounces back above 30
- RSI pulls back but does not go below 30 again
- RSI then breaks above the previous bounce high — this is the "failure swing"
The entry is triggered at Step 4 — when RSI breaks above the previous bounce high. The corresponding price action usually shows a momentum candle close.
This signal is more reliable than simple divergence because it requires RSI to actively demonstrate that selling pressure has failed to push RSI below 30 again.
Bearish Failure Swing (Short Setup)
- RSI rises above 70 (overbought)
- RSI pulls back below 70
- RSI bounces but does not go above 70 again
- RSI then breaks below the previous pullback low
Entry is at Step 4, when RSI breaks below the prior low.
[Diagram: Left panel — bullish failure swing showing RSI dipping below 30, bouncing, staying above 30 on the second dip, then breaking the prior bounce high. Right panel — bearish failure swing. Caption: "The RSI failure swing requires four steps. The critical event is Step 3: RSI fails to make a new extreme, signalling momentum has reversed."]
Time-Based Filters for RSI Scalping
RSI divergence on 1-min and 3-min charts is context-dependent. The same divergence signal that works well at 10:30 AM on Bank Nifty may fail completely at 12:15 PM. Here is when to trade and when to step back.
Best sessions for RSI scalping on Indian indices
- 9:30–11:00 AM: Prime window. Institutional activity drives clean momentum moves. RSI divergences have strong follow-through.
- 1:00–2:30 PM: Good second window. Post-lunch pickup in activity on most days. Divergences form cleanly with volume confirmation.
- 2:30–3:30 PM: Advanced scalpers only. F&O unwinding and end-of-day position squaring can produce sharp moves but also sharp reversals. RSI divergences in this window can fail quickly.
Avoid RSI scalping during
- 9:15–9:30 AM (opening volatility)
- 11:30 AM–1:00 PM (mid-day chop)
- RBI policy announcement days and Budget day (first 2 hours after open)
For expiry-specific timing rules, read: 5 Rules Every Trader Must Follow on Nifty Options Expiry Day
RSI Scalping on Bank Nifty Options — Monthly Expiry
Bank Nifty moved to monthly-only expiry in November 2024 (weekly expiry was discontinued when SEBI restricted each exchange to one weekly options contract — NSE chose Nifty 50). Bank Nifty now expires on the last Tuesday of each month. Monthly Bank Nifty options remain one of the most liquid instruments for intraday scalpers in the days leading up to expiry.
Use the underlying, not the options chart. Run RSI on spot Bank Nifty or Bank Nifty futures. Do not run RSI on the options price chart, options premiums are distorted by IV, theta decay, and bid-ask spread. Analyse the underlying and execute on options.
Stick to ATM (At The Money) options. OTM options may look attractive because of their lower premium, but their delta is low — meaning even a correct directional call on the underlying produces minimal profit on the option. ATM options have delta close to 0.5 and move approximately 0.5x the underlying's move.
RSI divergence on 1-min Bank Nifty underlying: When a divergence forms, the move that follows often lasts 8–15 minutes. That is enough time to enter and exit an ATM option with a 30–60 point underlying move — translating to 15–30 points of premium per unit (₹450–900 per lot of 30).
For more on how options expiry and settlement works, read: Option Expiry & Settlement Explained: Weekly vs Monthly Options in India
Journal Questions for RSI Scalping
After every RSI scalp trade, ask yourself:
- Was the divergence clearly visible — two distinct swing points with price and RSI moving in opposite directions?
- Did I have a confirming entry candle before entering, or did I jump in early?
- Was the trade in the direction of the 15-min trend, or against it?
- What was my RSI value at entry — was it near an extreme (under 35 for longs, above 65 for shorts) or near the 50-line?
- Did the trade fail? If so, was there a signal I missed — flat volume, a news event, a trend conflict on the higher timeframe?
50 logged trades with these questions answered gives you a personalised data set that tells you exactly which RSI setups work best in your trading style and time window. See also: Best Scalping Indicators: Which Ones Work (And How to Combine Them)
Key Takeaways
- Use RSI(7) on 3-min charts and RSI(5) on 1-min charts — the standard 14-period RSI is too slow for scalping.
- RSI divergence (price making new extremes while RSI diverges) is the highest-probability scalp signal. Confirm with a momentum entry candle.
- The RSI failure swing is even more powerful than divergence — learn to identify its four-step pattern.
- The 50-line crossover works well on trending days as a momentum entry signal.
- Best trading windows: 9:30–11:00 AM and 1:00–2:30 PM on most days.
- Analyse the underlying (spot or futures) for RSI signals, then execute on options if that is your instrument of choice.
- Bank Nifty is monthly-only expiry (last Tuesday of the month) since November 2024. Weekly Bank Nifty options no longer exist.
Disclaimer: This article is for educational purposes only and does not constitute financial or investment advice. Scalping involves significant risk and is not suitable for all traders. Past patterns and historical analysis do not guarantee future results. Trading in F&O and derivative instruments carries substantial risk of capital loss. Please consult a SEBI-registered investment advisor before making trading decisions.