
Best Scalping Indicators and How to Combine Them for Better Trades
5 indicators that actually work for scalping Indian markets — with the exact settings, 3 ready-to-use combinations, and a 2-minute pre-session routine to pick the right one.
The best scalping indicators are VWAP (trend and fair value), 9/21 EMA crossover (momentum direction), RSI on a 1-minute chart (overbought/oversold extremes), and volume (confirming breakouts). Use maximum 2-3 together — VWAP + EMA gives direction, volume gives conviction. Avoid indicators that repaint or lag heavily on 1-minute charts. The real edge is not the indicator itself but the discipline to only take trades where 2 of your chosen indicators agree.
Best Scalping Indicators: Which Ones Actually Work (And How to Combine Them)
Part of the Scalping Trading Strategies: Complete Guide series.
Here's the uncomfortable truth: most traders use indicators wrong. They stack 5–6 indicators on a 1-minute chart, wait for all of them to "agree," and by the time the signals align, the move is over.
Indicators don't predict the future. They describe what has already happened, but with a lag. This guide cuts through the noise. Five indicators. Exact settings for Indian index scalping. Three combination frameworks you can apply today.
The Only 5 Indicators That Matter for Scalping
1. VWAP — Your Intraday Compass
What it does: VWAP (Volume Weighted Average Price) calculates the average price weighted by volume for the entire session. It tells you where the "fair value" is, the price at which the most volume has transacted today.
Why it matters for scalping: Institutions benchmark their execution against VWAP. If the price is above VWAP, the session has a bullish bias; buyers are in control. Below VWAP, bearish. This single reading gives you directional context before you even look at an entry signal.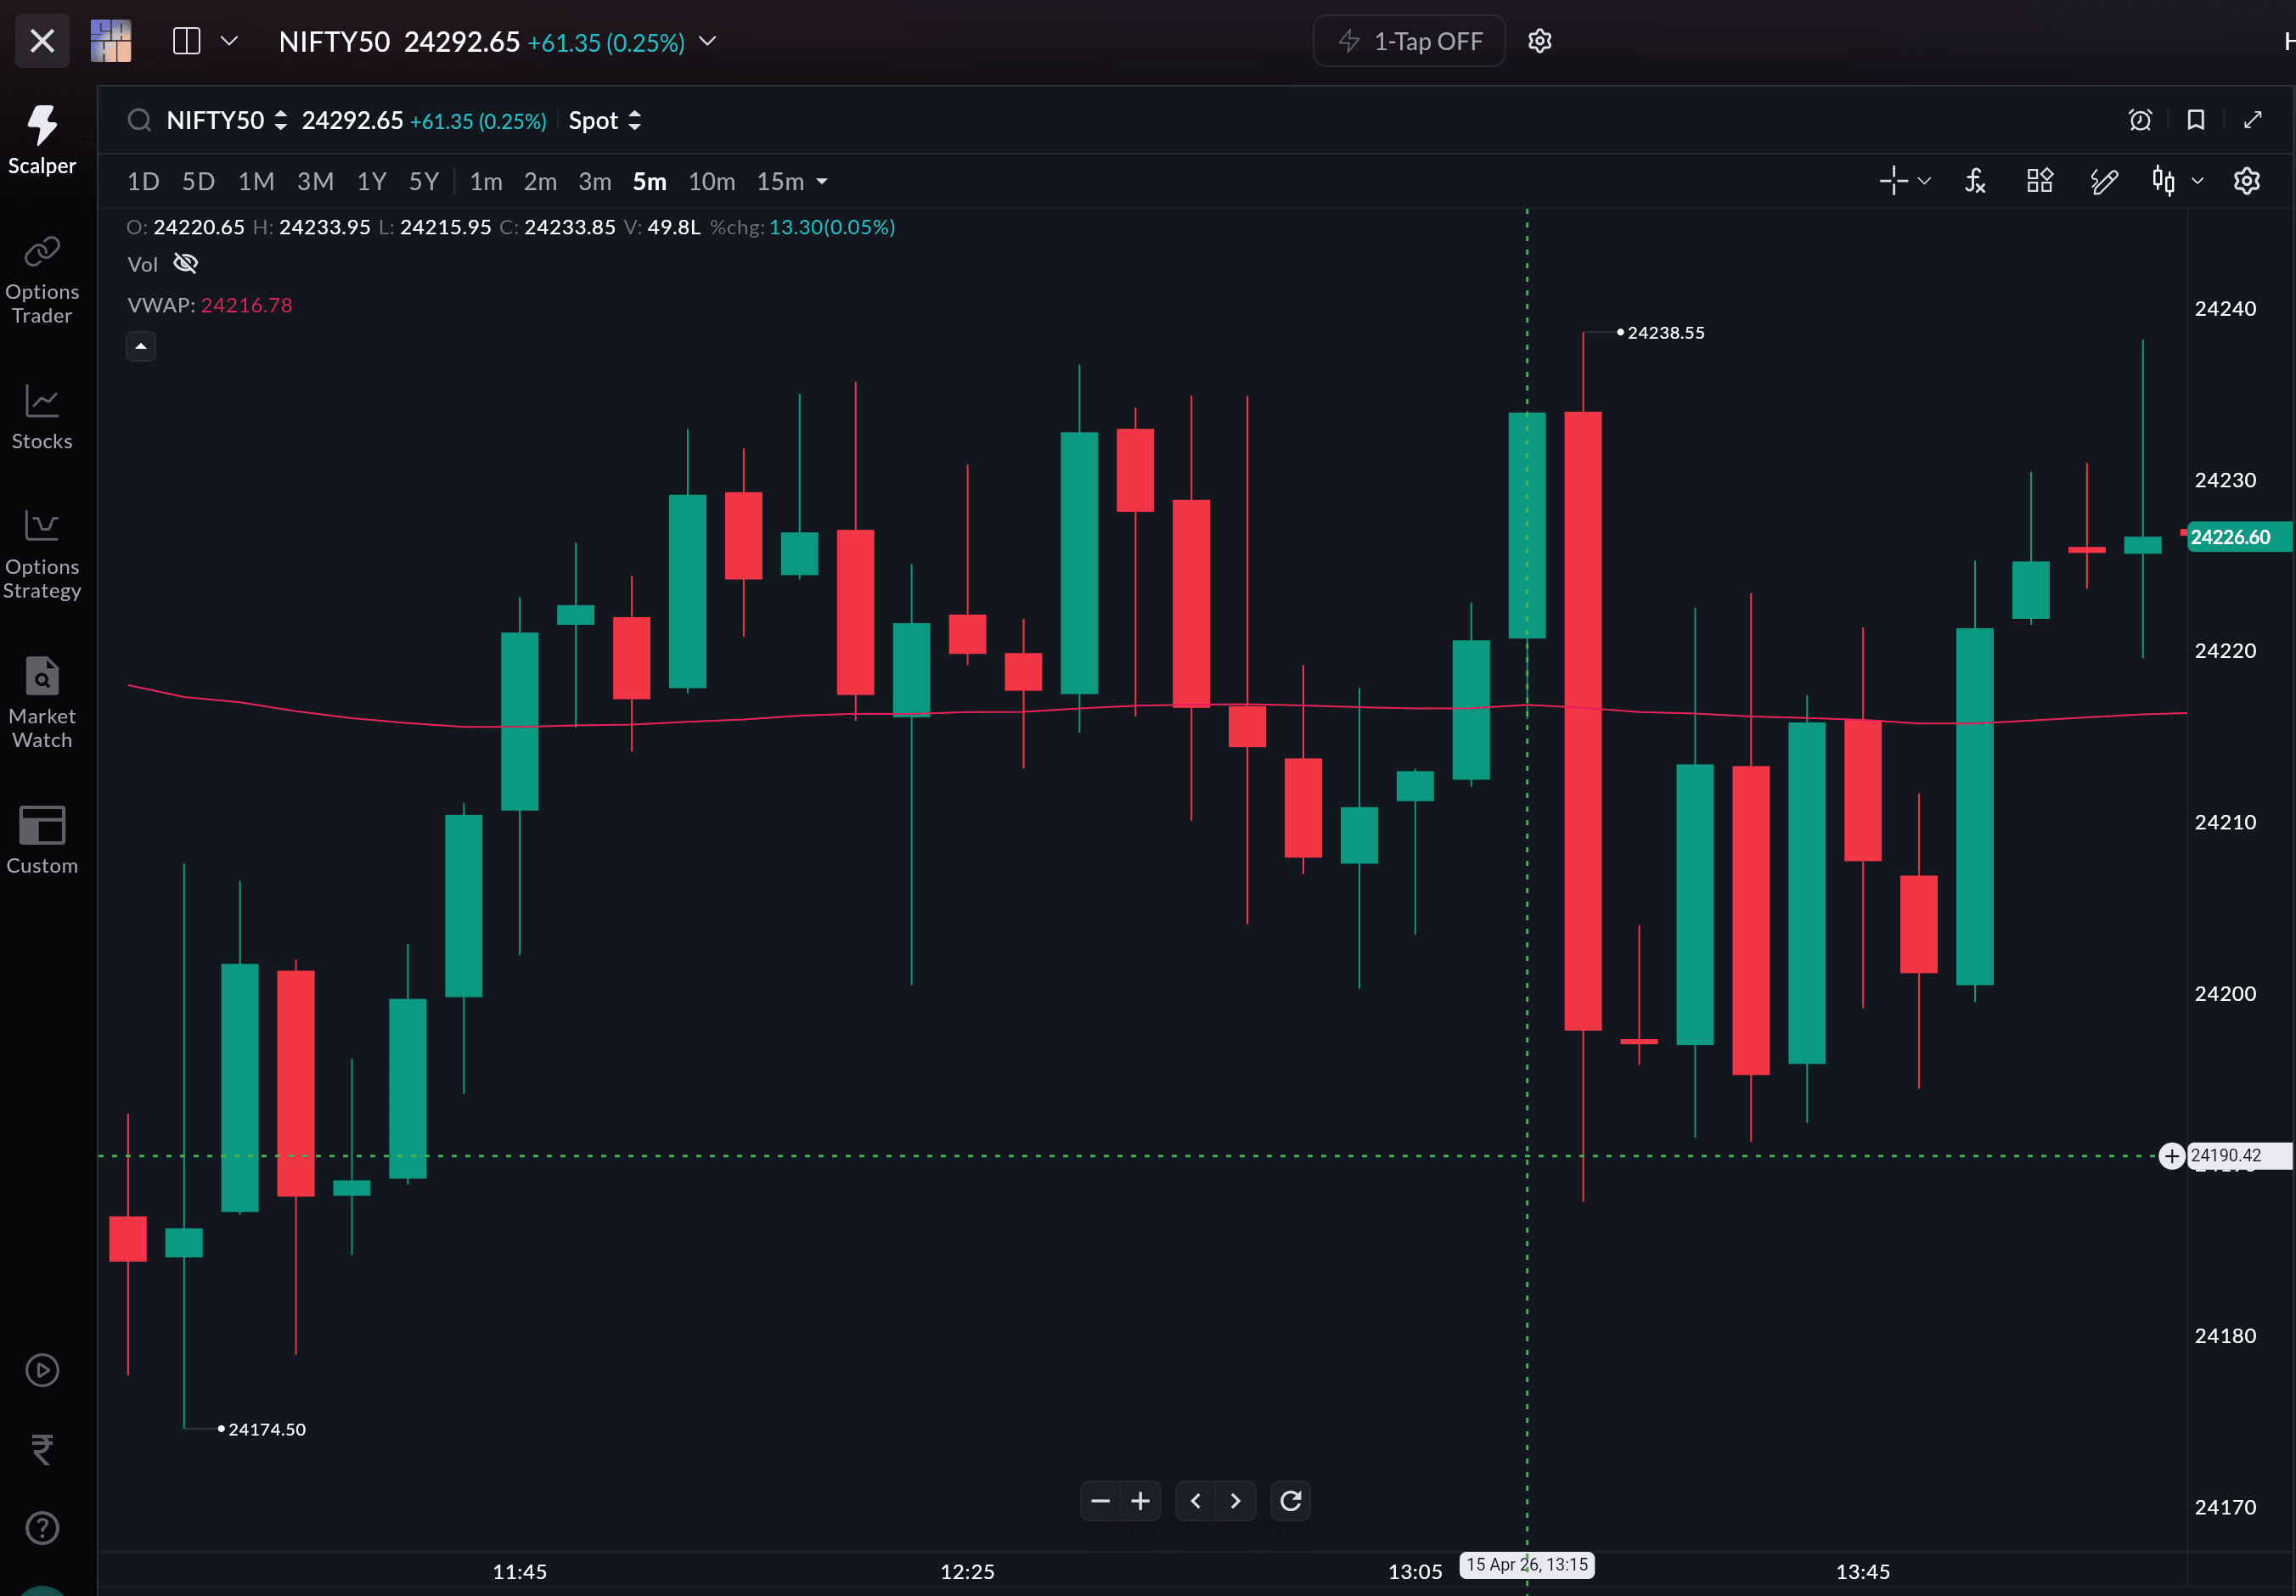
Settings: Default. VWAP resets every session and needs no parameter adjustment.
Only take long scalps when the price is above VWAP. Only take short scalps when the price is below VWAP. This one filter alone eliminates a significant number of losing trades.
2. EMA (9 and 21) — Your Momentum Signal
What it does: The Exponential Moving Average weights recent prices more heavily than older ones, making it faster than SMA. The 9 EMA reacts to the last ~9 candles; the 21 EMA smooths across ~21.
Why it matters for scalping: The relationship between the 9 and 21 EMA tells you who's in control right now. When the 9 is above the 21 and both are rising, short-term momentum is bullish. When the 9 crosses below the 21, momentum is flipping.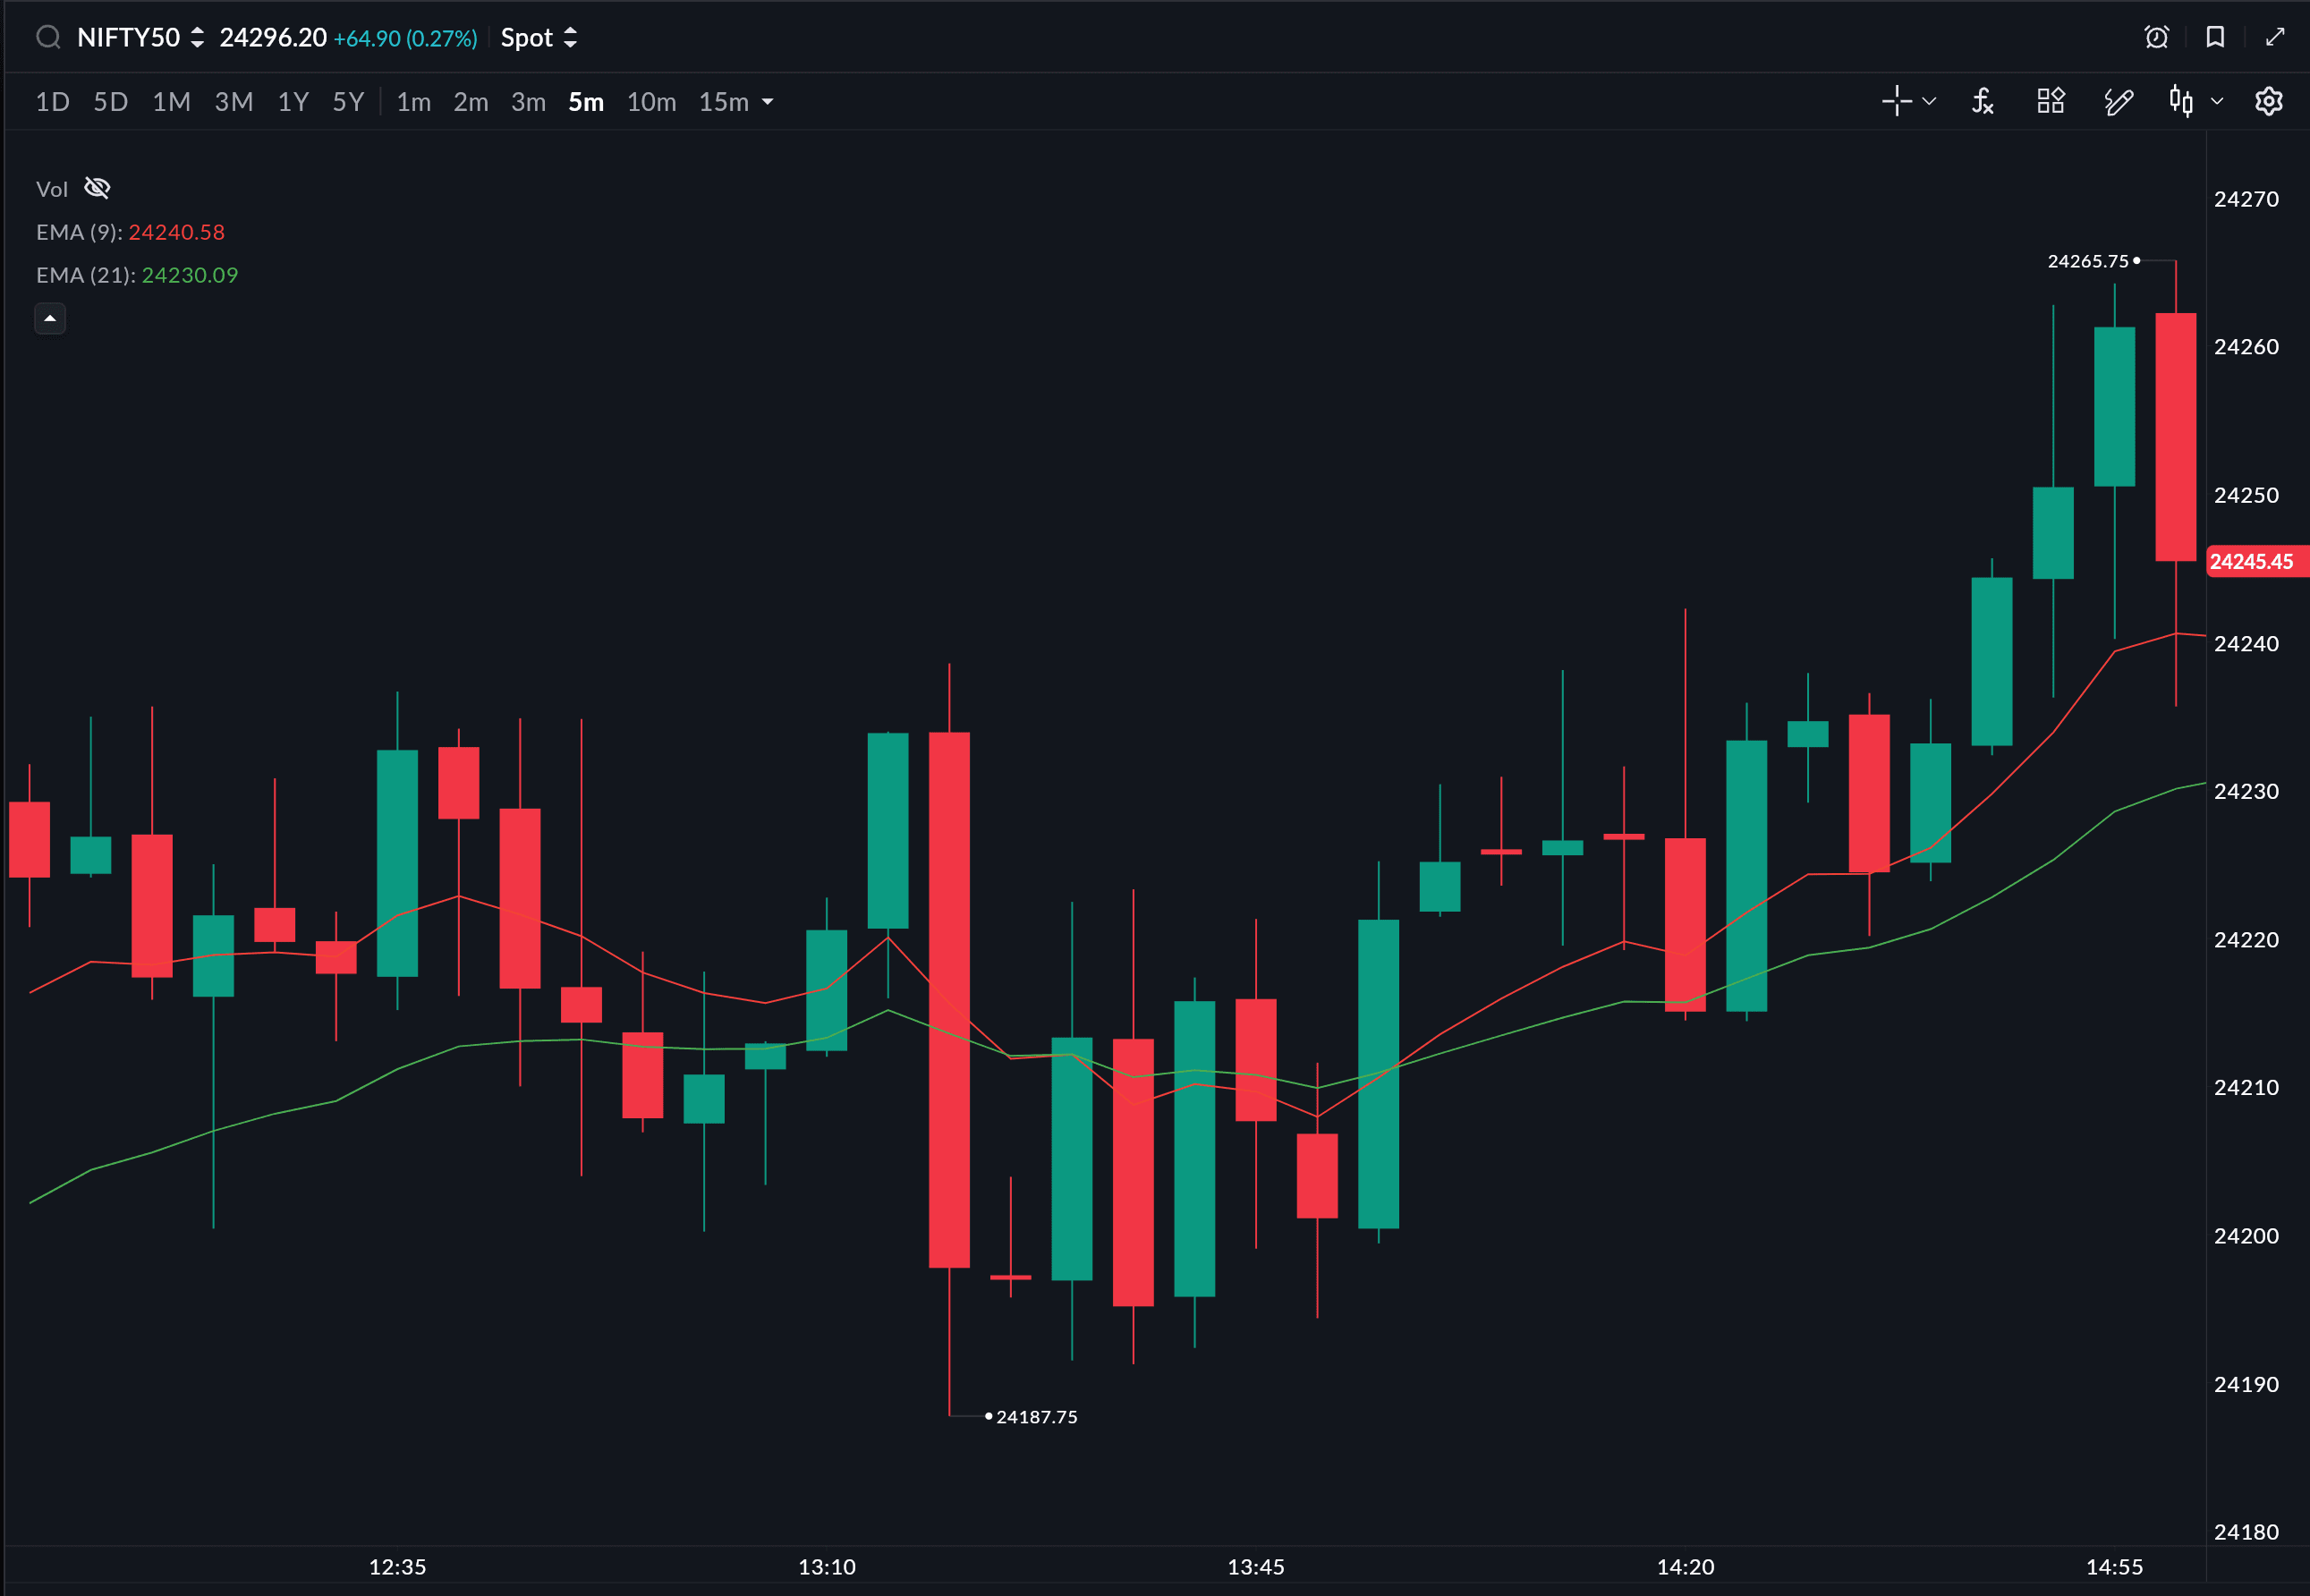
Settings: 9-period EMA and 21-period EMA on your 1-minute or 3-minute chart.
Actionable rule: Enter long when the 9 EMA crosses above the 21 EMA and price is above VWAP. Enter short when the 9 EMA crosses below the 21 EMA and price is below VWAP. Trail your stop just below the 21 EMA — when price closes below it, the momentum is done.
On Sahi, the Moving Average Crossover indicator auto-detects crossovers and lets you choose between SMA, EMA, and Hull MA types.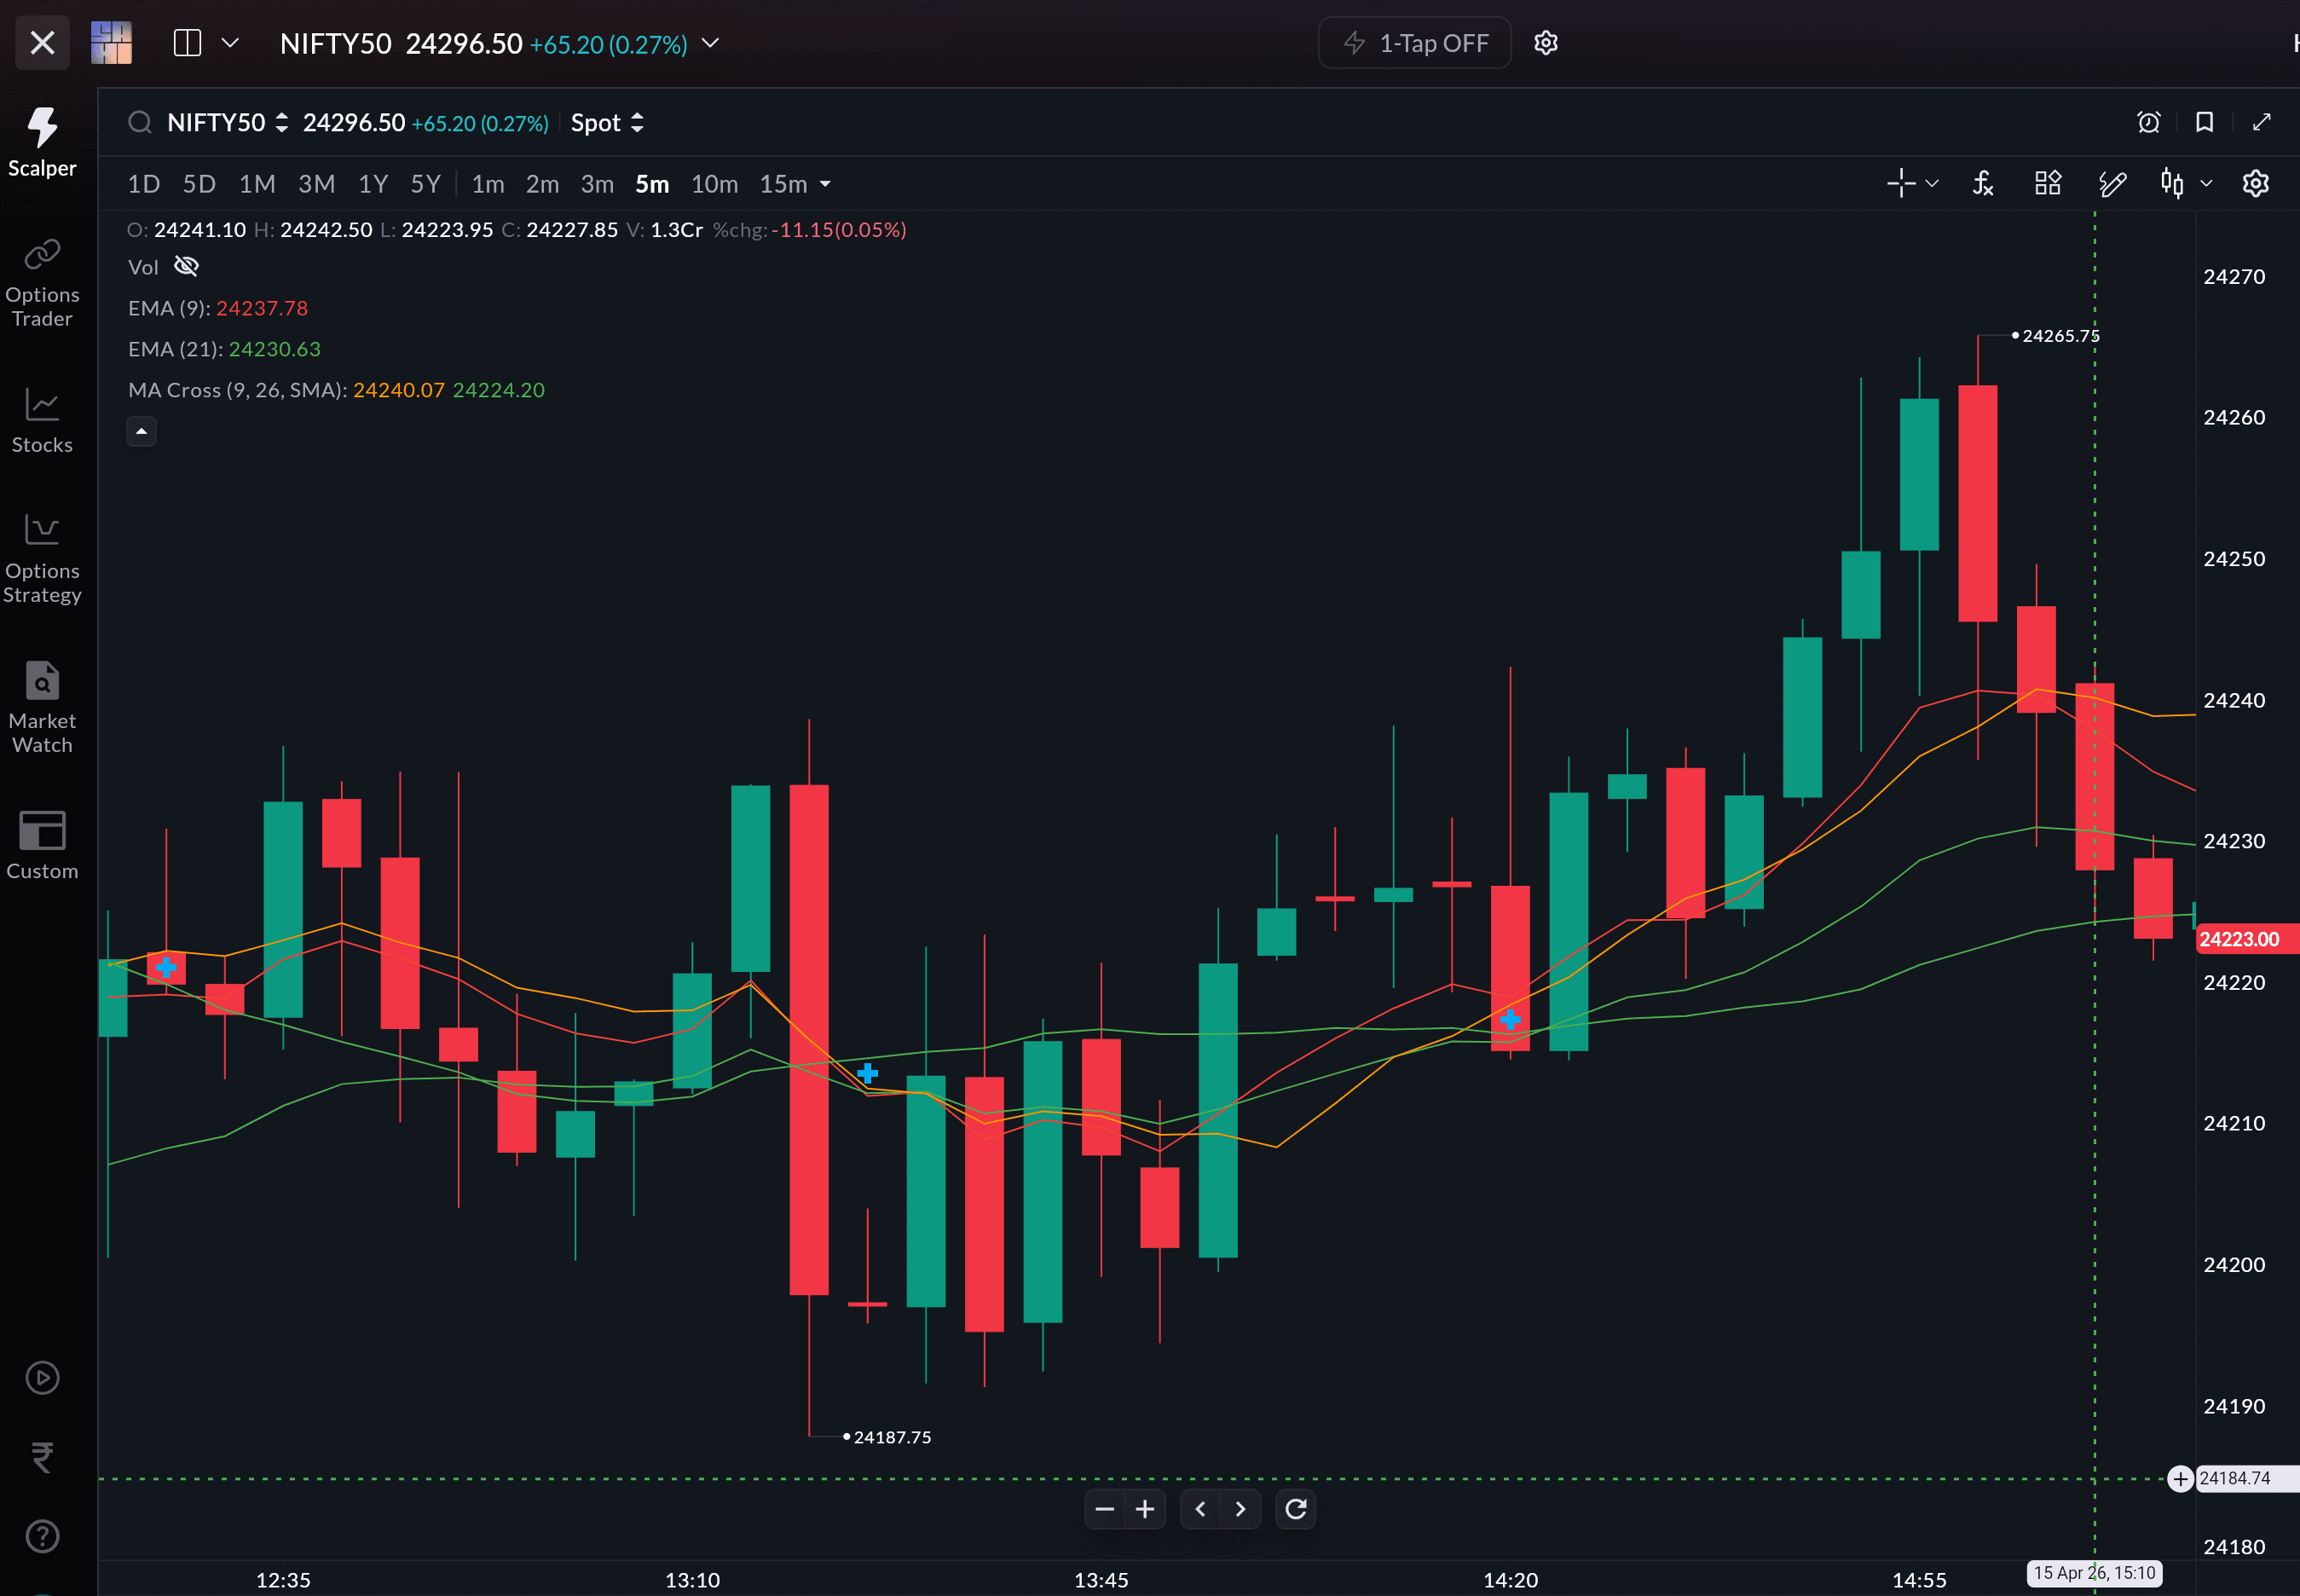
3. RSI (Period 7) — Your Divergence Detector
What it does: RSI measures momentum on a 0–100 scale. The default period of 14 is designed for daily charts — far too slow for scalping.
Why it matters for scalping: On a shortened period (7 or 9), RSI becomes sensitive enough to catch divergences on 1-minute charts. Bullish divergence (price makes a lower low, RSI makes a higher low) at a support level is one of the highest-probability reversal signals in scalping.
Settings: Period 7 (or 9). Overbought: 80. Oversold: 20.
Actionable rule: Don't buy just because RSI is below 20. And don't sell just because it's above 80. Instead, use RSI for one thing: divergence. When price makes a new low but RSI doesn't, selling pressure is exhausting. When price makes a new high but RSI doesn't, buying pressure is fading. Trade the divergence, at a key level, with a tight stop.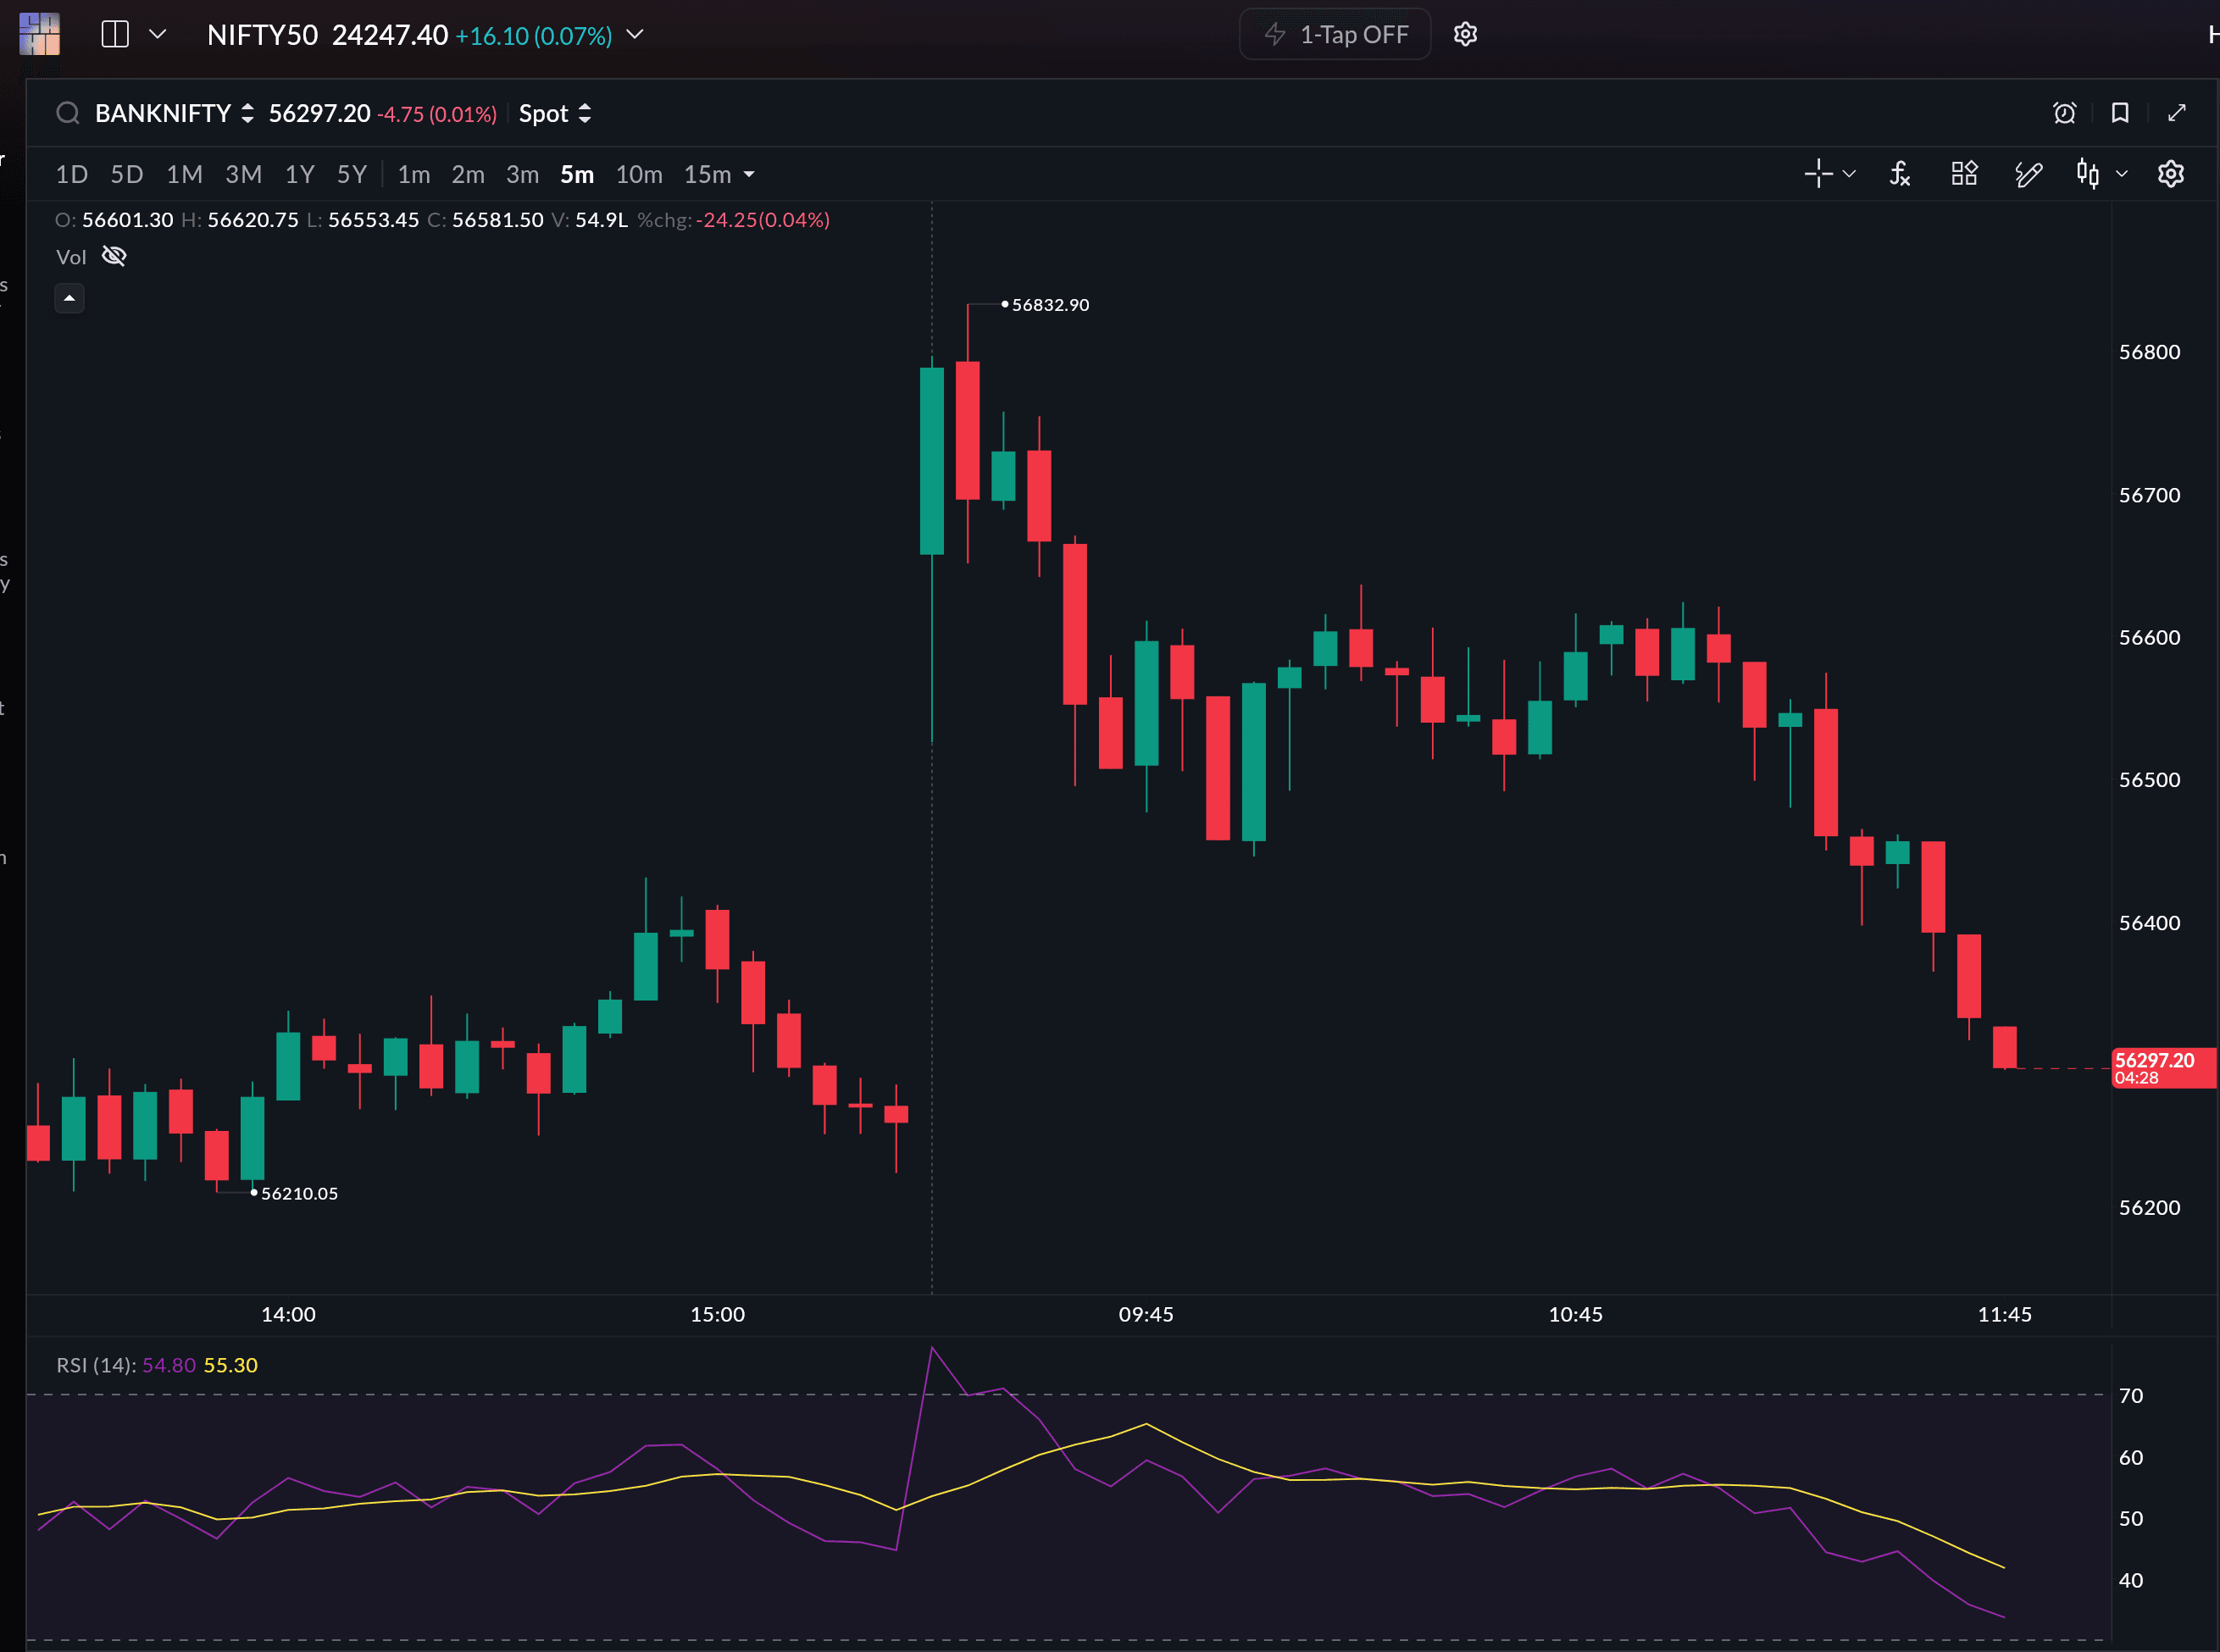
Sahi supports smoothened RSI to cut false signals, and you can stack multiple RSI instances on the same chart to compare different periods.
4. Bollinger Bands — Your Volatility Map
What it does: Bollinger Bands plot a 20-period SMA with upper and lower bands at 2 standard deviations. When volatility expands, bands widen. When it contracts, they squeeze.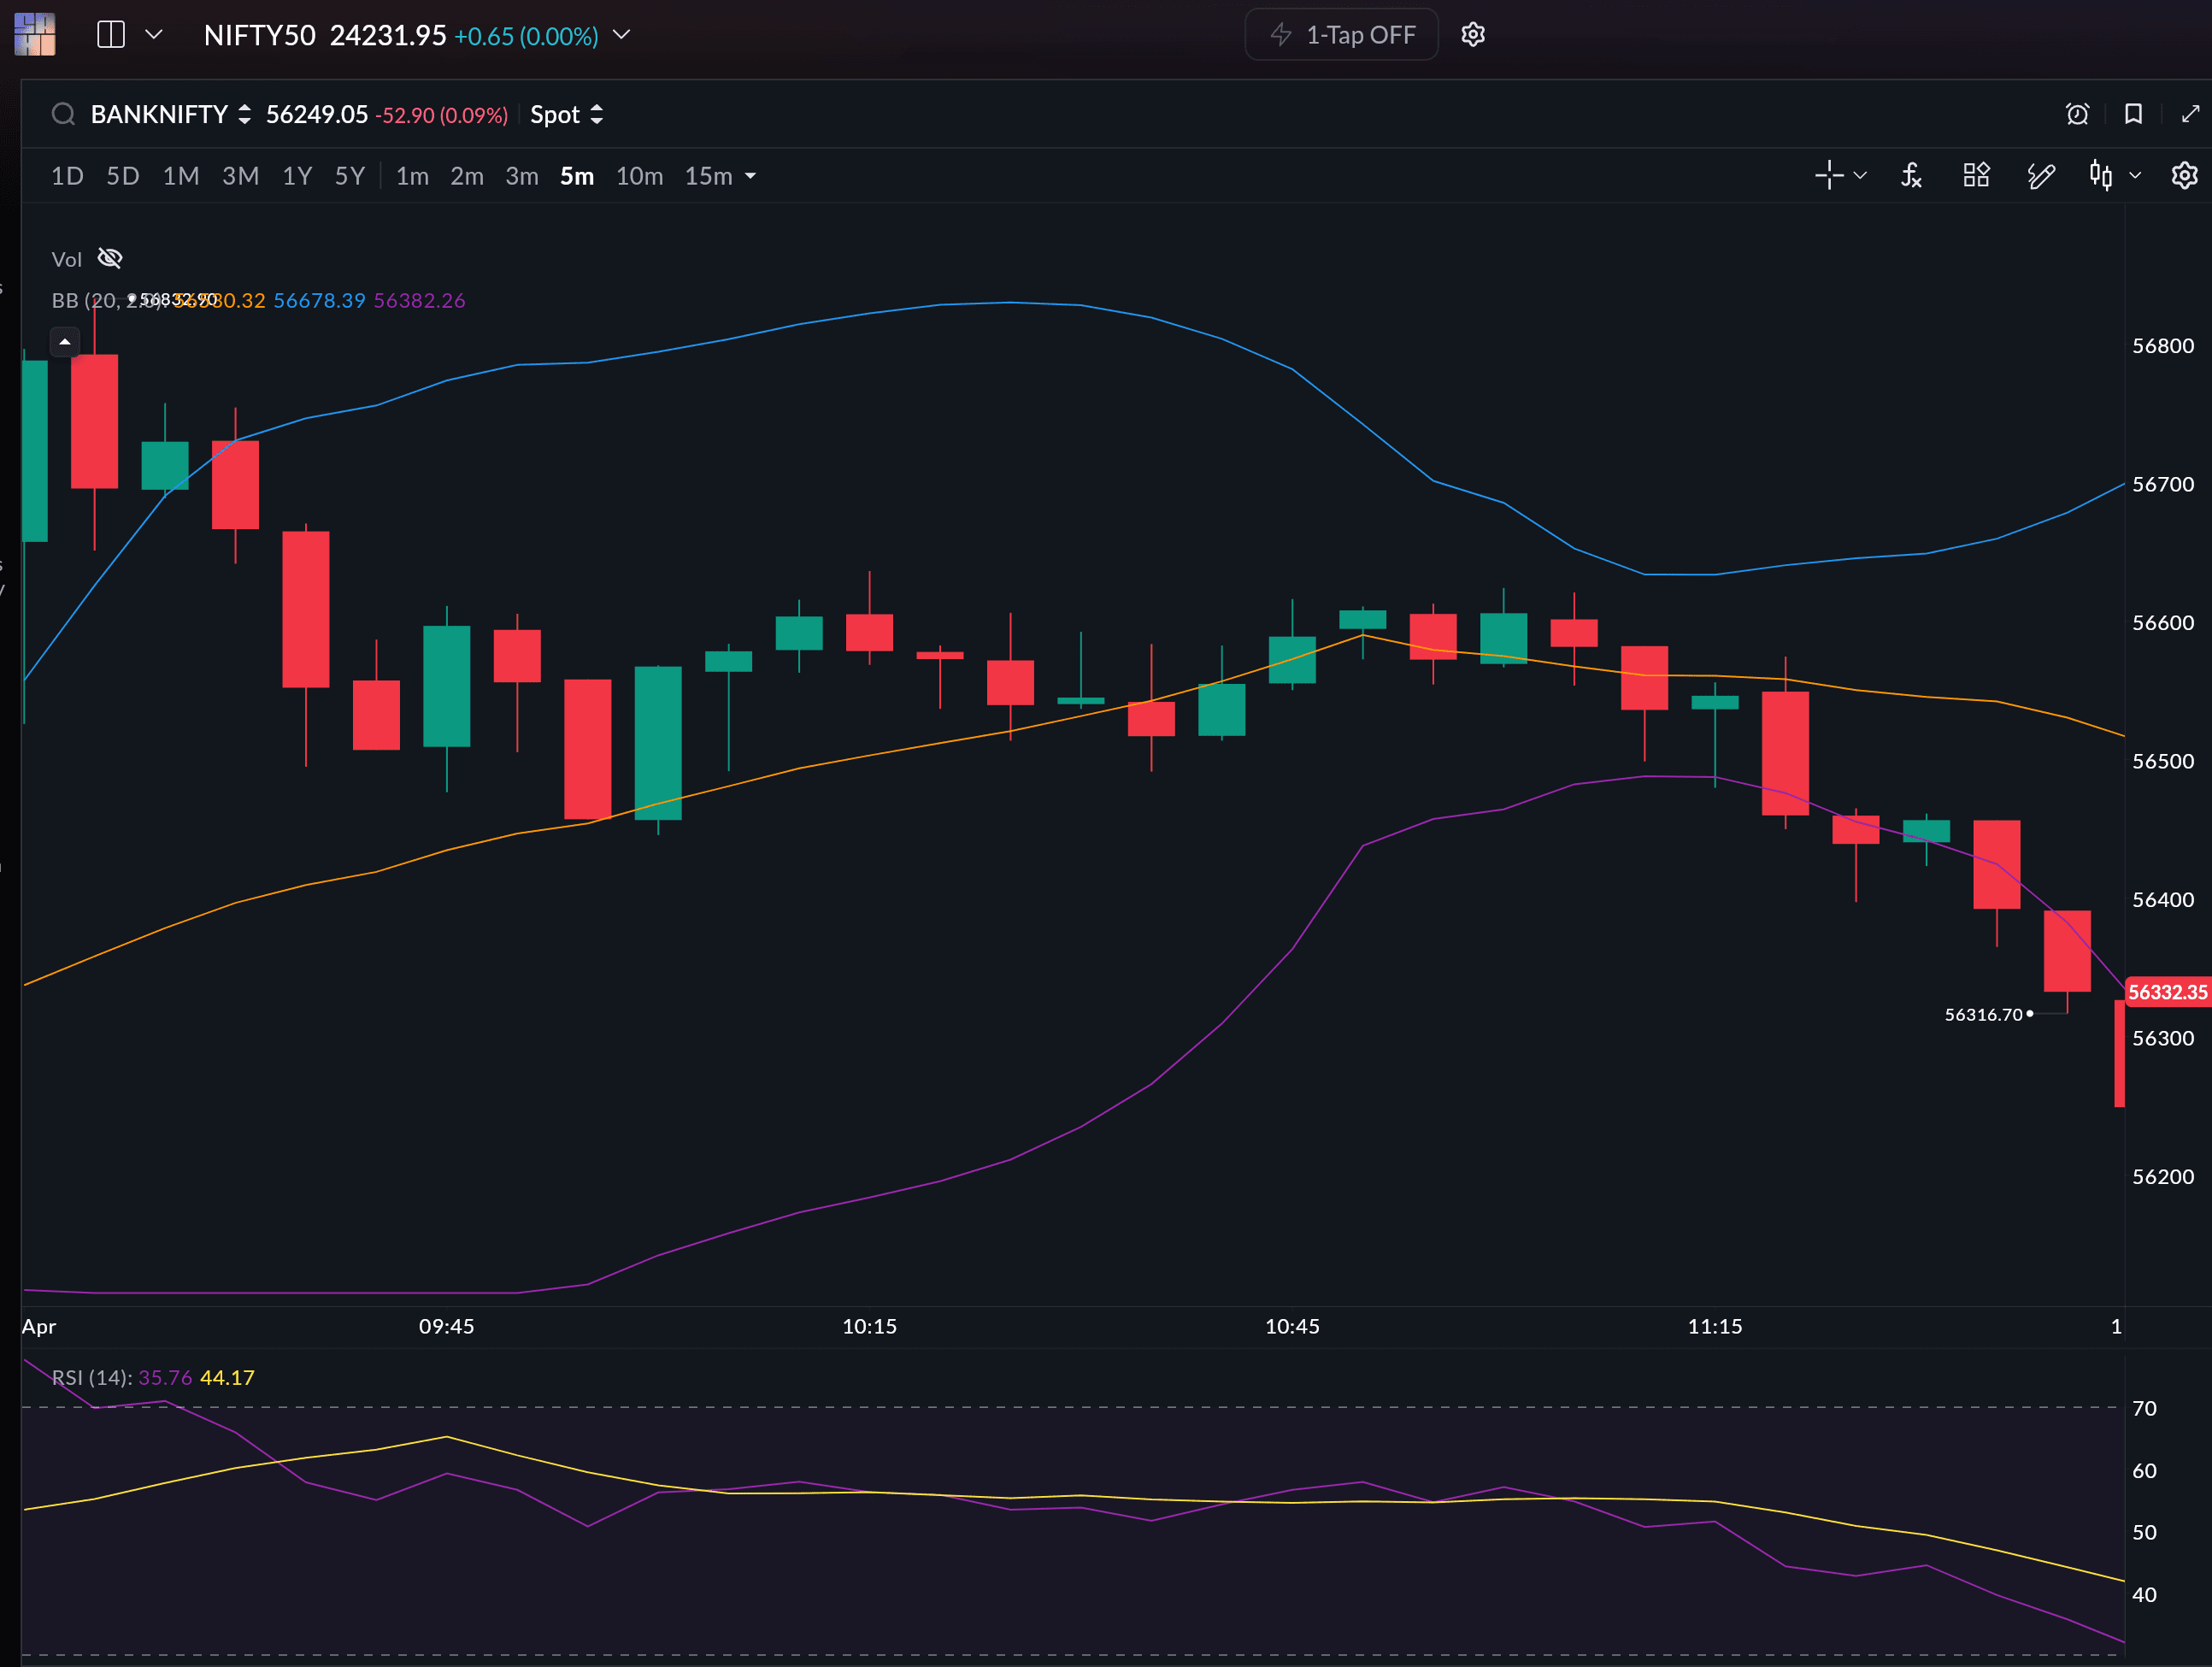
Why it matters for scalping: Two distinct uses. In ranging markets, price touching the lower band with RSI below 20 is a mean reversion buy signal (target: middle band). In all markets, a Bollinger squeeze (bands contracting tightly) signals that a breakout is imminent — you just don't know the direction yet.
Settings: 20-period SMA, 2 standard deviations. Default works well.
Actionable rules:
- Mean reversion (ranging market): Price touches lower band + RSI (7) below 20 + price at or near a known support level → buy. Target: middle band. Stop: below the band touch low.
- Squeeze breakout: Bands contract to their tightest point of the session. Wait. When price breaks above the upper band with volume + 9 EMA crossing above 21 EMA → enter in the breakout direction. This combo filters out false squeeze breakouts.
5. Volume — The Non-Negotiable Confirmation Layer
What it does: Volume measures participation. It's not a signal generator — it's a signal validator.
Why it matters for scalping: A breakout without volume is a fake breakout. An EMA crossover without volume is noise. Every signal from the four indicators above needs volume confirmation.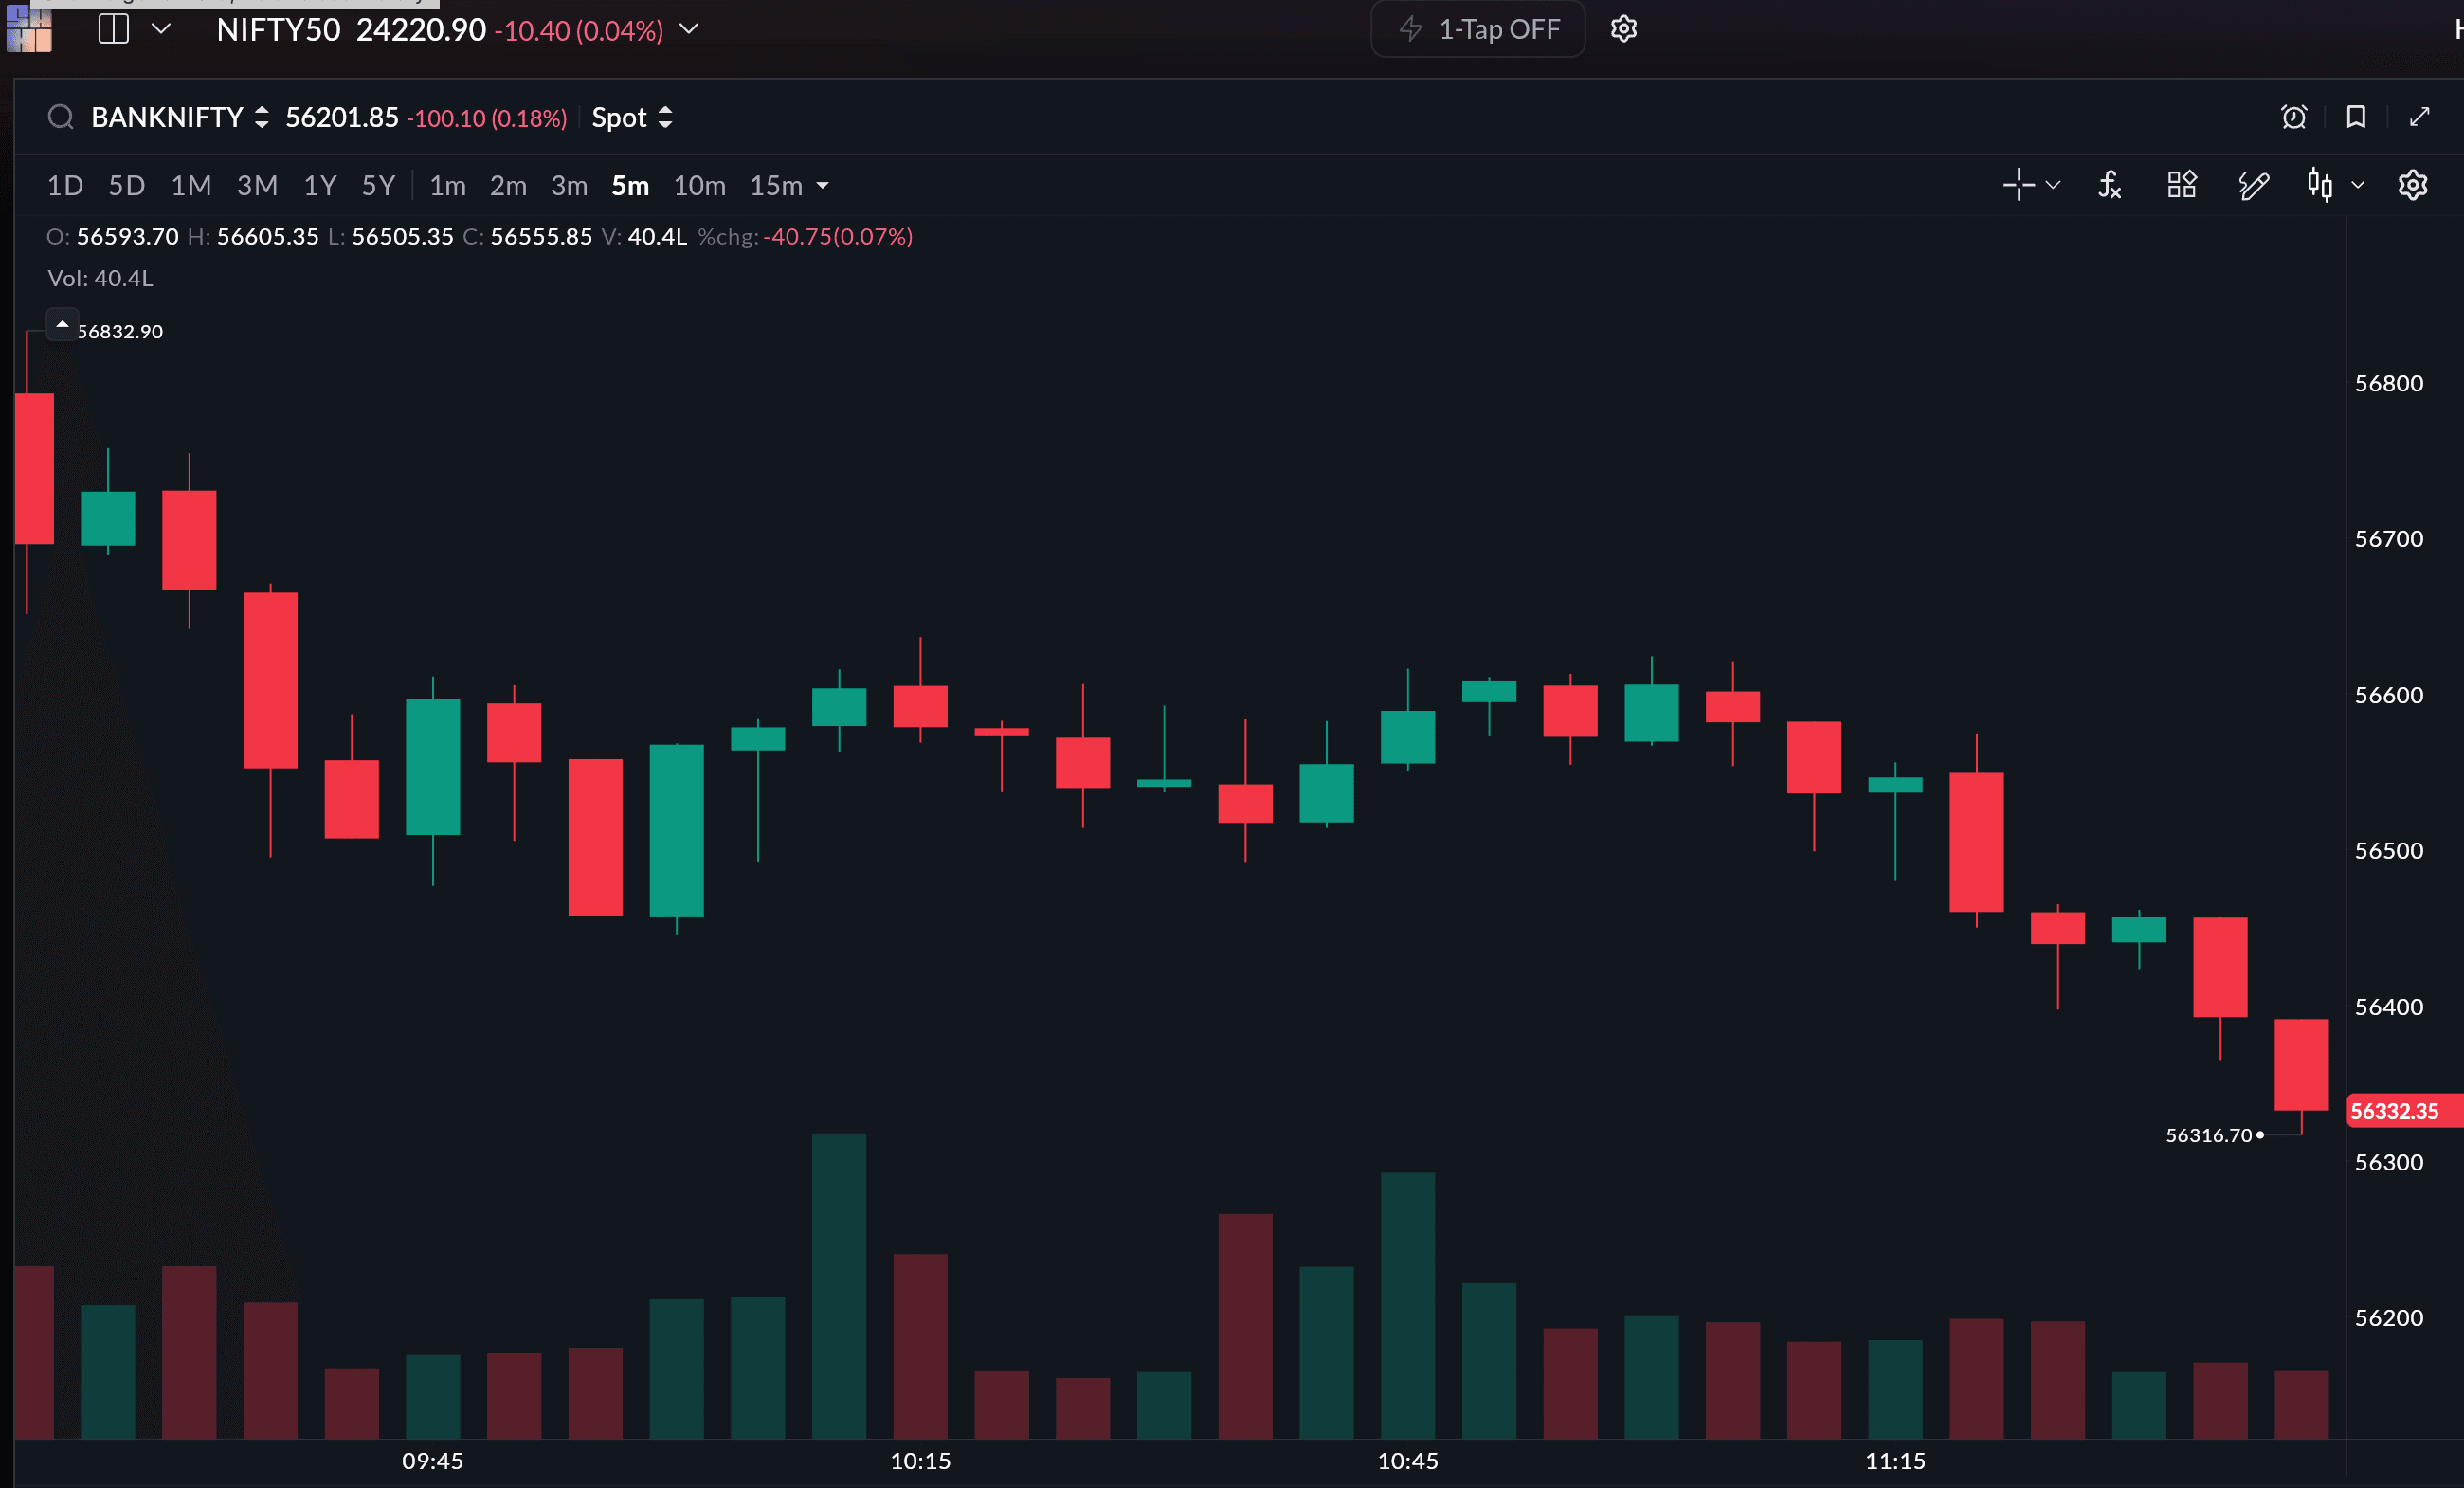
Settings: Default volume bars. Optionally add OBV (On-Balance Volume) for cumulative direction confirmation.
Actionable rule: Before entering any scalp, check: is the volume bar on the signal candle above the 20-bar average? Yes → proceed. No → skip.
The 3 Indicator Combinations That Actually Work
Don't use all 5 at once. Pick one combination based on today's market condition. Each combo serves a different purpose — and using the wrong one in the wrong market is worse than using no indicators at all.
Combo 1: Trend Scalping (for trending days)
Indicators: VWAP + 9/21 EMA + Volume
When: Nifty is making clear higher highs/higher lows on the 15-minute chart. VWAP is sloping.
Setup: Price pulls back to VWAP or the 21 EMA. The 9 EMA is still above the 21 EMA (trend intact). A bullish candle forms at the pullback zone with above-average volume. Enter long. Stop below the pullback low. Target: 1:1.5 R or trail below the 21 EMA.
Combo 2: Mean Reversion (for ranging days)
Indicators: Bollinger Bands + RSI (7) + Volume
When: VWAP is flat. Nifty is oscillating between a clear range. Bollinger Bands are horizontal.
Setup: Price touches the lower Bollinger Band. RSI (7) is below 20. The price is at or near a known support level. A rejection candle forms (hammer, engulfing) with a volume spike. Enter long. Stop below the band touch. Target: middle band (20 SMA).
Combo 3: Breakout Scalping (for squeeze days)
Indicators: Bollinger Bands + 9/21 EMA + Volume
When: Bollinger Bands have contracted to their tightest width of the session. Market is coiling.
Setup: Wait for the squeeze. When price breaks outside the upper or lower band with a strong candle + 9 EMA crossing the 21 EMA in the same direction + volume surge → enter. Stop: opposite side of the squeeze range. Target: 1:2 R. This combo is particularly effective during the first 30 minutes after open, when overnight consolidation breaks into directional flow.
Pre-Session Routine: Open Sahi Scalper → check the 15-minute Nifty chart → is VWAP sloping (trending) or flat (ranging)? → check Bollinger Band width (squeezed or expanded?) → this tells you which combo to load for the day. Takes 2 minutes. Saves hours of fighting the wrong market.
What NOT to Do
Don't stack 5+ indicators. Two indicators agreeing is confirmation. Four indicators partly agreeing is confusion.
Don't use default RSI (14) for scalping. Period 14 was designed for daily charts. On a 1-minute chart, it's too slow. Use 7 or 9.
Don't treat indicators as buy/sell buttons. "RSI below 30 = buy" is how beginners blow accounts. RSI below 30 in a strong downtrend means the trend is strong, not that a reversal is coming. Context always overrides the number.
Don't ignore volume. A crossover on thin volume is the market coughing. A crossover on heavy volume indicates that the market is reacting strongly.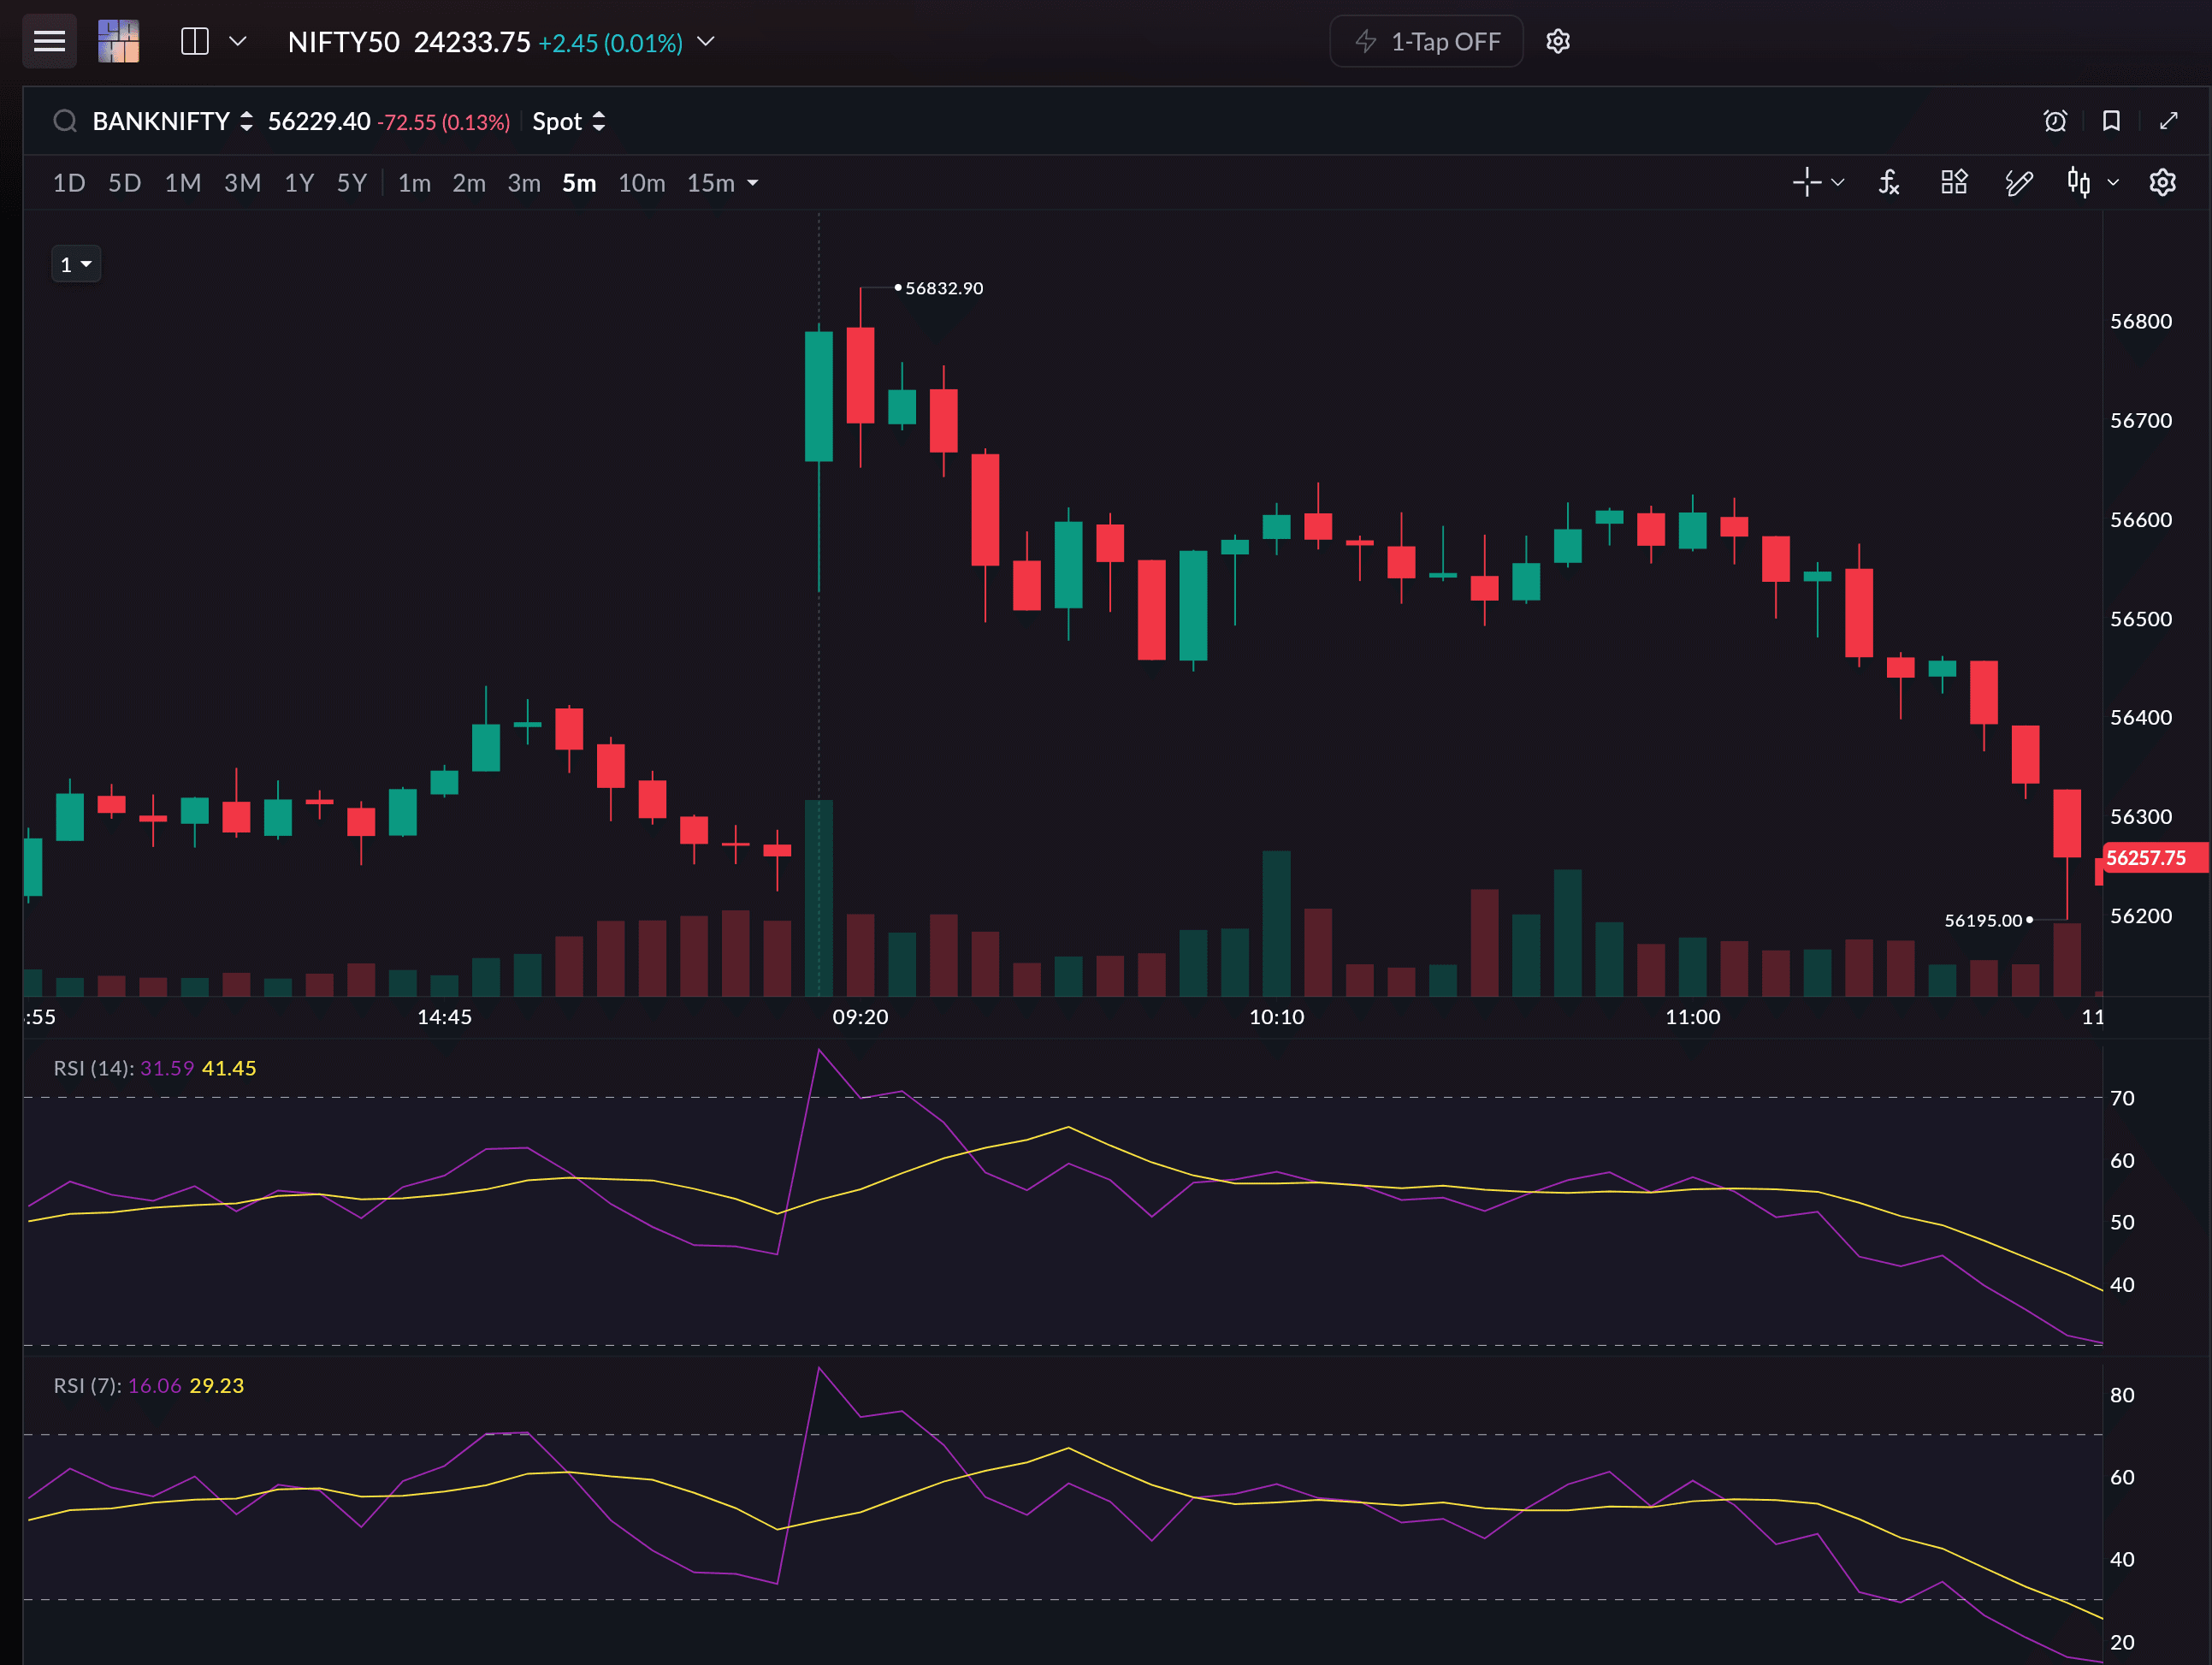
The multi-indicator stacking feature lets you add multiple instances of the same indicator — like two RSIs with different periods or two EMAs with different lookbacks — on a single chart. Test Combo 1 vs Combo 2 setups side by side without switching layouts.
Start Here
If you're new to indicator-based scalping, start with Combo 1 (VWAP + 9/21 EMA + Volume) on a trending day. It's the simplest framework with the fewest variables. Master that before adding RSI divergence or Bollinger squeezes to your toolkit.
Use Sahi's Practice Mode to replay past sessions and test each combo without risking capital. Open Scalper Mode → tap the question mark → enter Practice Mode. Fast-forward through a day, apply your indicators, and mark where each combo would have given you an entry. After 10 sessions of practice, you'll know which combo fits your trading style.
Disclaimer: The content provided is for educational purposes only and does not constitute financial advice. Trading in securities involves significant risk, including the risk of loss. Past performance does not guarantee future results. Always conduct your own research and consider consulting a SEBI-registered investment adviser before making trading decisions. Sahi is a SEBI-registered stockbroker.