
Apollo Tyres Q1 Results 2027: PAT Increases 26x to ₹349 Cr
Apollo Tyres reported double-digit revenue growth and a sharp rise in net profit during Q1 FY27, while EBITDA margin moderated due to higher operating costs.

Apollo Tyres Q1 Results FY2027: Apollo Tyres reported a steady performance in Q1 FY27, supported by healthy revenue growth across key markets. The company witnessed strong improvement in profitability compared with the year-ago quarter, although operating margins moderated due to higher expenses and pressure on EBITDA margins compared with the previous quarter.
Apollo Tyres Q1 Results FY2027: On 6 August 2026, Apollo Tyres announced its financial results for the first quarter ended 30 June 2026. Revenue from Operations increased 12.76% YoY to ₹7,398 crore compared with ₹6,561 crore in Q1 FY26.
While Profit After Tax (PAT) increased to ₹349 crore compared with ₹13 crore in Q1 FY26. EBITDA Margin stood at 11.73% during the quarter.
Total Revenue stood at ₹7,456 crore during Q1 FY27, registering a growth of 13.32% compared with ₹6,580 crore in Q1 FY26. Compared with ₹7,371 crore in Q4 FY26, total revenue increased 1.16% QoQ.
Apollo Tyres share price closed 1.08% higher on 6 August 2026. The stock has delivered -9% returns year-to-date and 4% returns over the one year from 6 August 2025 to 6 August 2026.
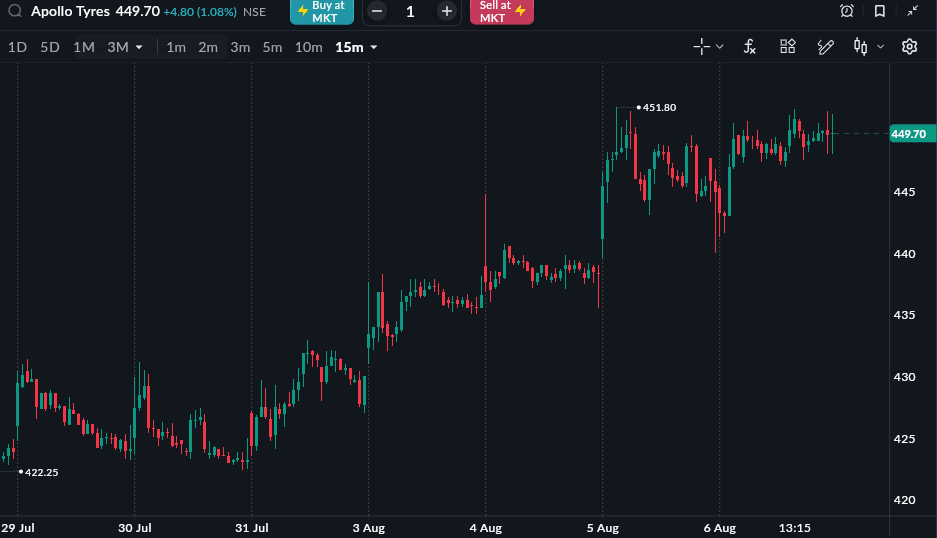
As of 6 Aug, 3:30 PM
Apollo Tyres Q1 FY27 Results Highlights
-
Revenue from Operations stood at ₹7,398 crore, registering a 12.76% YoY increase from ₹6,561 crore in Q1 FY26. Compared with ₹7,336 crore in Q4 FY26, revenue increased 0.85% QoQ.
-
Total Revenue stood at ₹7,456 crore, registering a 13.32% YoY increase from ₹6,580 crore in Q1 FY26. Compared with ₹7,371 crore in Q4 FY26, total revenue increased 1.16% QoQ.
-
EBITDA (excluding Other Income) stood at ₹868 crore, compared with ₹868 crore in Q1 FY26, registering a marginal increase of 0.03% YoY. Compared with ₹1,069 crore in Q4 FY26, EBITDA declined 18.79% QoQ.
-
EBITDA Margin stood at 11.73%, compared with 13.23% in Q1 FY26 and 14.57% in Q4 FY26, declining by 1.49 percentage points YoY and 2.84 percentage points QoQ.
-
Profit After Tax (PAT) stood at ₹349 crore, compared with ₹13 crore in Q1 FY26, registering a growth of 2,612.75% YoY. Compared with ₹631 crore in Q4 FY26, PAT declined 44.71% QoQ.
-
PAT Margin stood at 4.72%, compared with 0.20% in Q1 FY26 and 8.60% in Q4 FY26, improving by 4.52 percentage points YoY.
-
EPS stood at ₹5.52, compared with ₹0.20 in Q1 FY26, registering a 2,660% YoY increase. Compared with ₹9.97 in Q4 FY26, EPS declined 44.63% QoQ.
Apollo Tyres Q1 FY27 Financial Summary
|
Metric |
Q1 FY27 |
Q4 FY26 |
QoQ % |
Q1 FY26 |
YoY % |
|---|---|---|---|---|---|
|
Revenue from Operations (₹ Cr) |
7,398 |
7,336 |
0.85% |
6,561 |
12.76% |
|
Total Revenue (₹ Cr) |
7,456 |
7,371 |
1.16% |
6,580 |
13.32% |
|
EBITDA (₹ Cr) |
868 |
1,069 |
-18.79% |
869 |
0.03% |
|
EBITDA Margin |
11.73% |
14.57% |
-2.84 ppt |
13.23% |
-1.49 ppt |
|
PAT (₹ Cr) |
349 |
631 |
-44.71% |
13 |
Exp. up |
|
PAT Margin |
4.72% |
8.60% |
-3.89 ppt |
0.20% |
+4.52 ppt |
|
EPS (₹) |
5.52 |
9.97 |
-44.63% |
0.20 |
Exp. up |
Apollo Tyres Q1 FY27 Segment-wise Performance
Apollo Tyres reported healthy revenue growth across its major geographical segments during Q1 FY27. The APMEA (Asia Pacific, Middle East and Africa) region remained the largest contributor to revenue, while Europe business also recorded double-digit year-on-year growth. Other segments witnessed a decline due to lower contribution compared with the previous year.
|
Segment (₹ Cr) |
Q1 FY27 |
Q4 FY26 |
QoQ % |
Q1 FY26 |
YoY % |
|---|---|---|---|---|---|
|
APMEA |
5,529 |
5,346 |
3.41% |
4,829 |
14.50% |
|
Europe |
2,039 |
2,180 |
-6.50% |
1,848 |
10.31% |
|
Others |
230 |
226 |
1.88% |
1,139 |
-79.82% |
|
Total Revenue from Operations |
7,398 |
7,336 |
0.85% |
6,561 |
12.76% |
Source: Company Filing
All topics
Click the link, confirm the box next to sahi.com is checked — ignore any other results.