
AI in Trading: Can Artificial Intelligence Really Help You Read Charts Better?
How AI-powered indicators like Key Levels, Lorentzian Classification and the ML Adaptive Supertrend cut down manual chart analysis

AI in trading works as an assistant, not a replacement. AI-powered indicators like SAHI's Key Levels, Lorentzian Classification and Machine Learning Adaptive Supertrend scan price history to mark strong support zones, score momentum from -8 (strongly bearish) to +8 (strongly bullish), and classify volatility from 1 (low) to 3 (high), cutting manual chart analysis down to seconds.
Technical analysis sounds simple in theory: identify support and resistance levels, understand the trend, measure momentum and volatility, and make a decision.
In reality, it rarely works that smoothly.
A support level that looked strong in the morning can break by noon, while a reversal often becomes obvious only after it has already happened. The challenge isn't the lack of information - it's the sheer amount of it.
This is where AI is becoming part of the trader's toolkit.
Instead of replacing chart analysis, AI-powered indicators aim to simplify it by identifying key levels, measuring momentum, and assessing volatility in real time.
That's exactly what SAHI's AI indicators are designed to do: reduce the time spent on manual analysis so traders can focus more on decisions and less on drawing lines on charts.
The Problem With Support And Resistance
Ask ten traders to mark support and resistance levels on the same chart, and you'll probably get ten different answers. Let's take an example - take a look at the chart below and try marking the support and resistance levels yourself.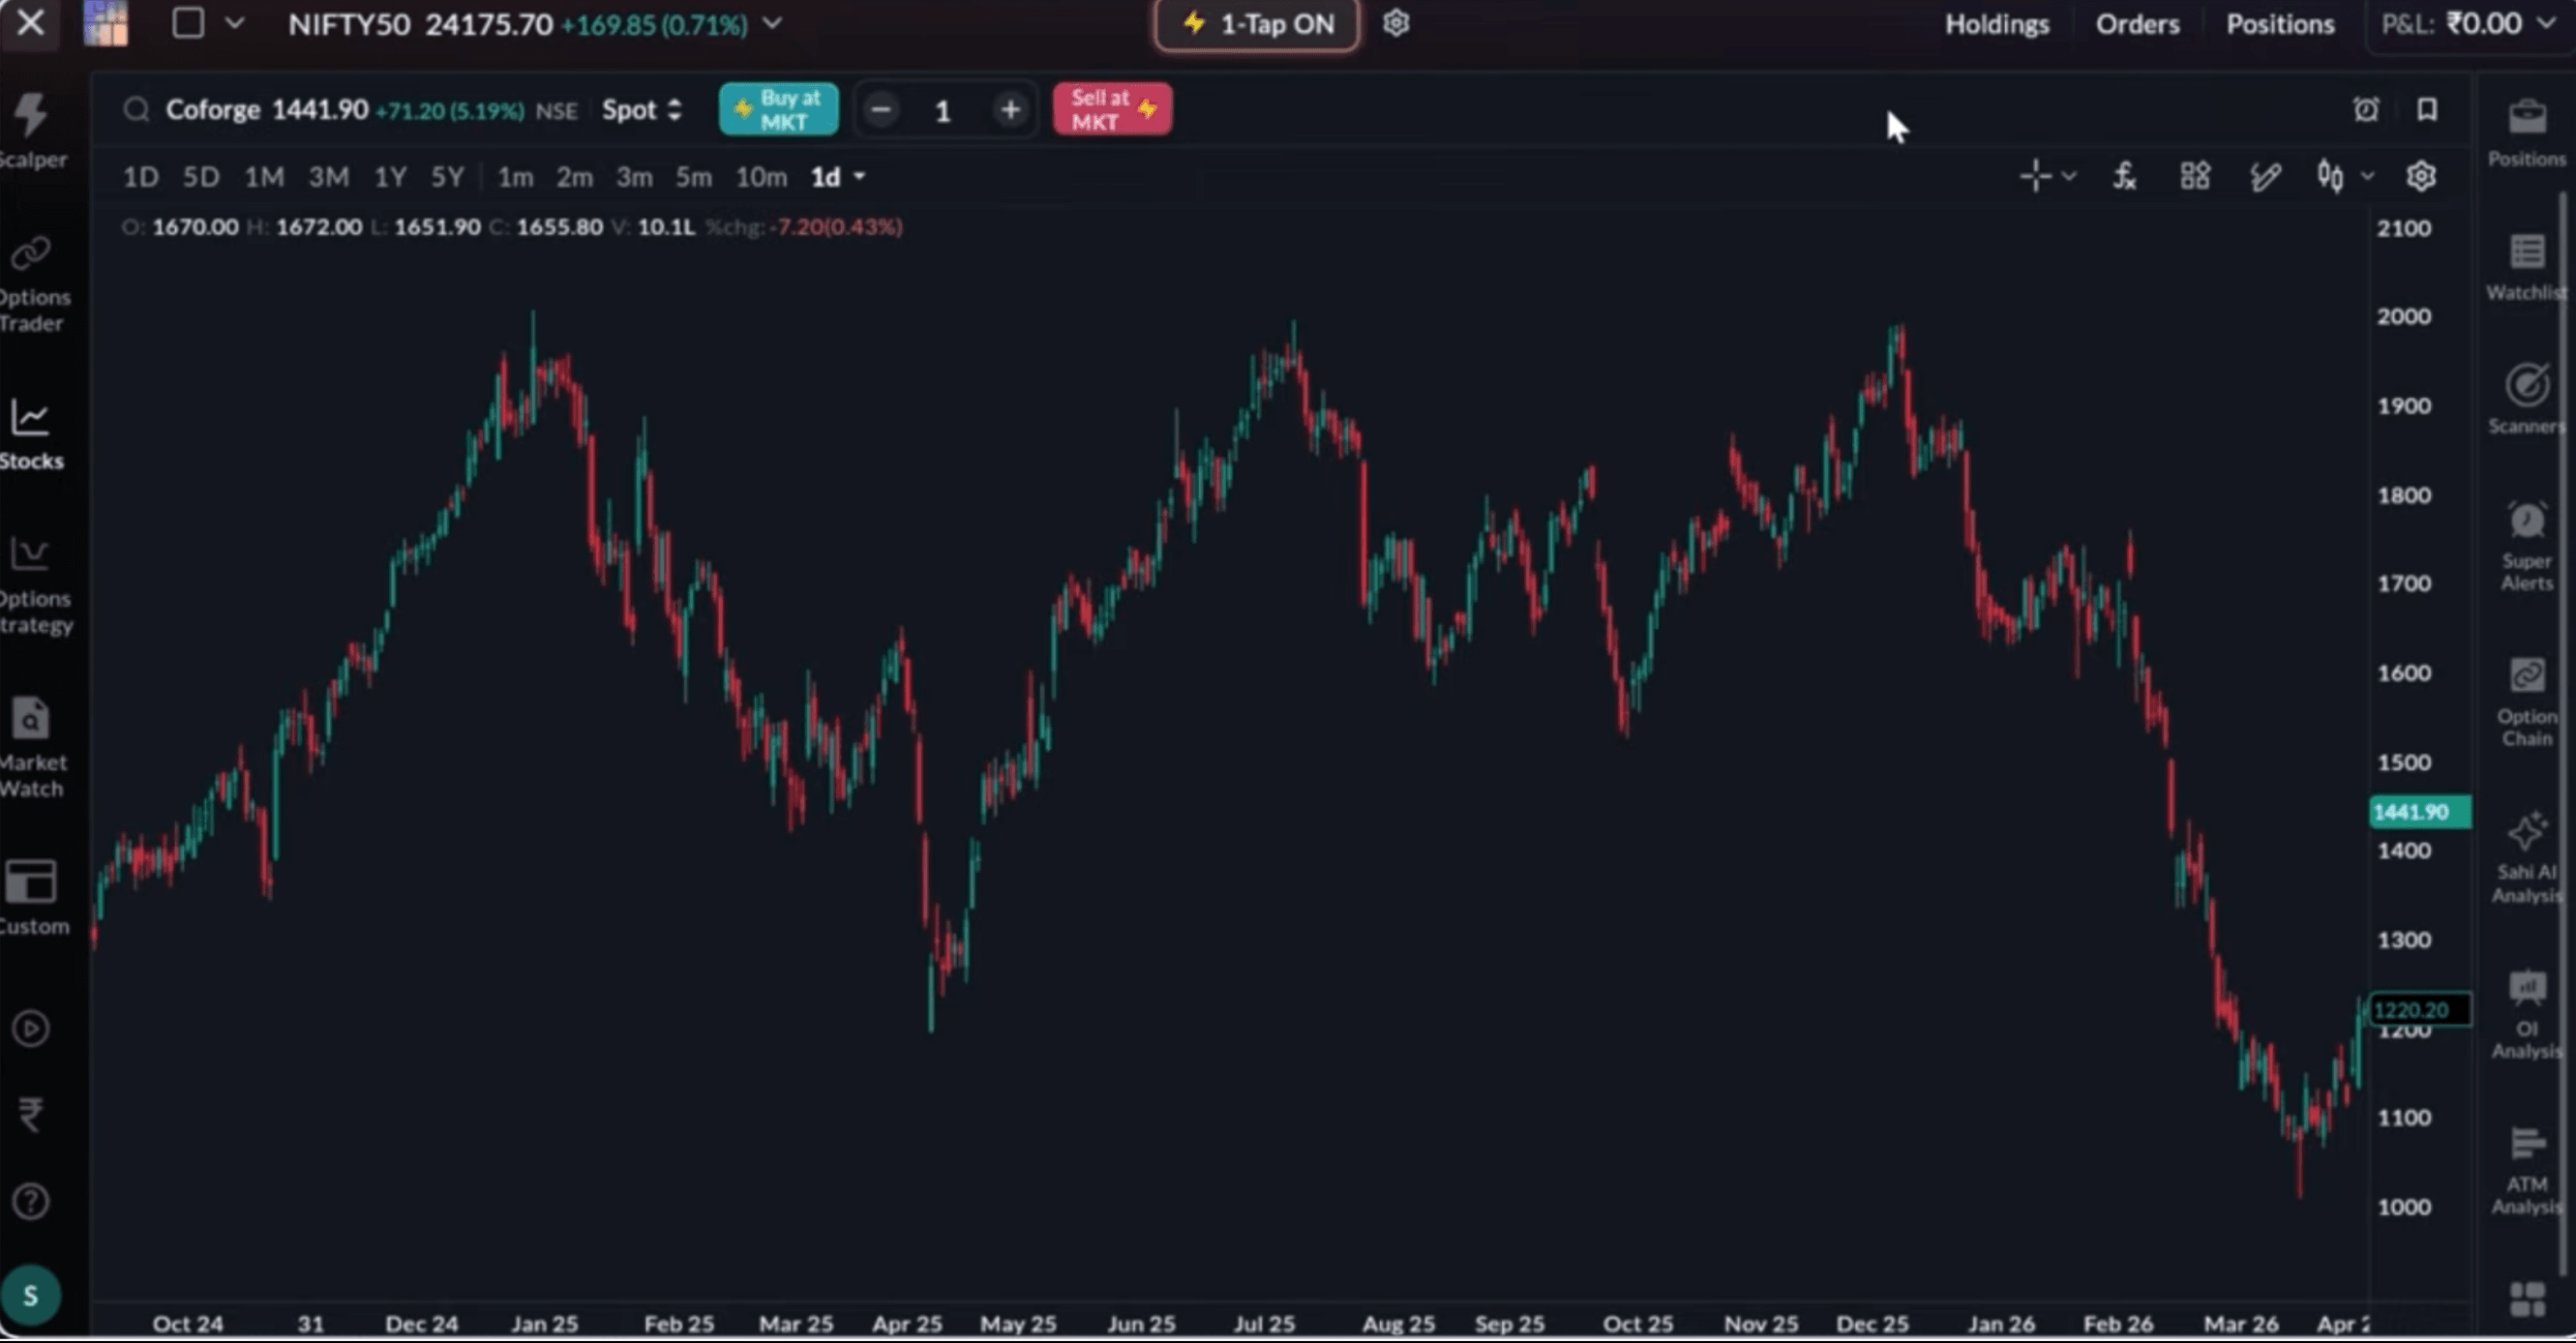
95% of the readers would have marked the support here: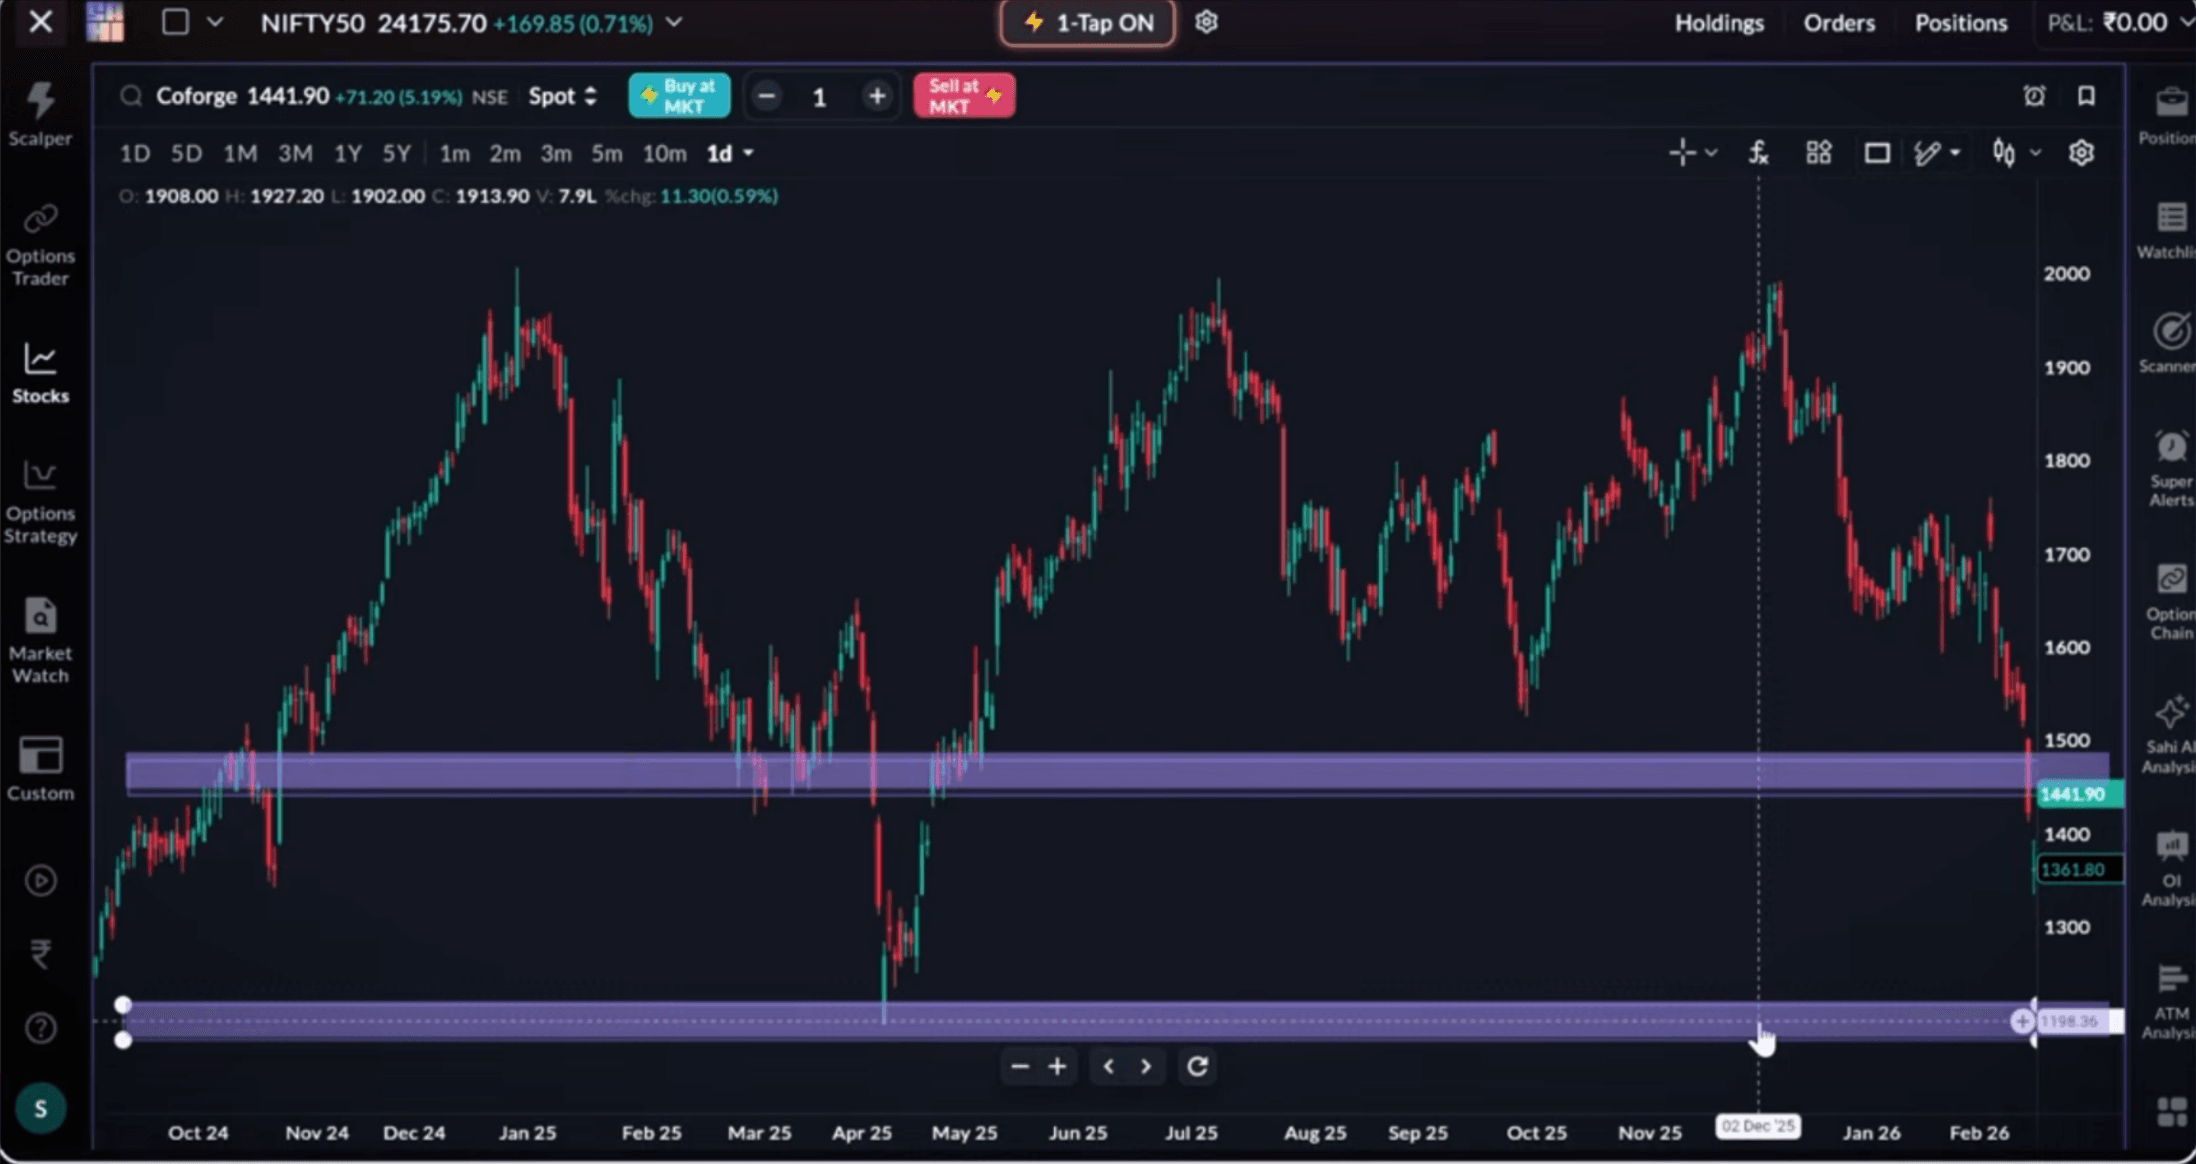
However, this is not where the price took support, which means you lost the opportunity to make more profits.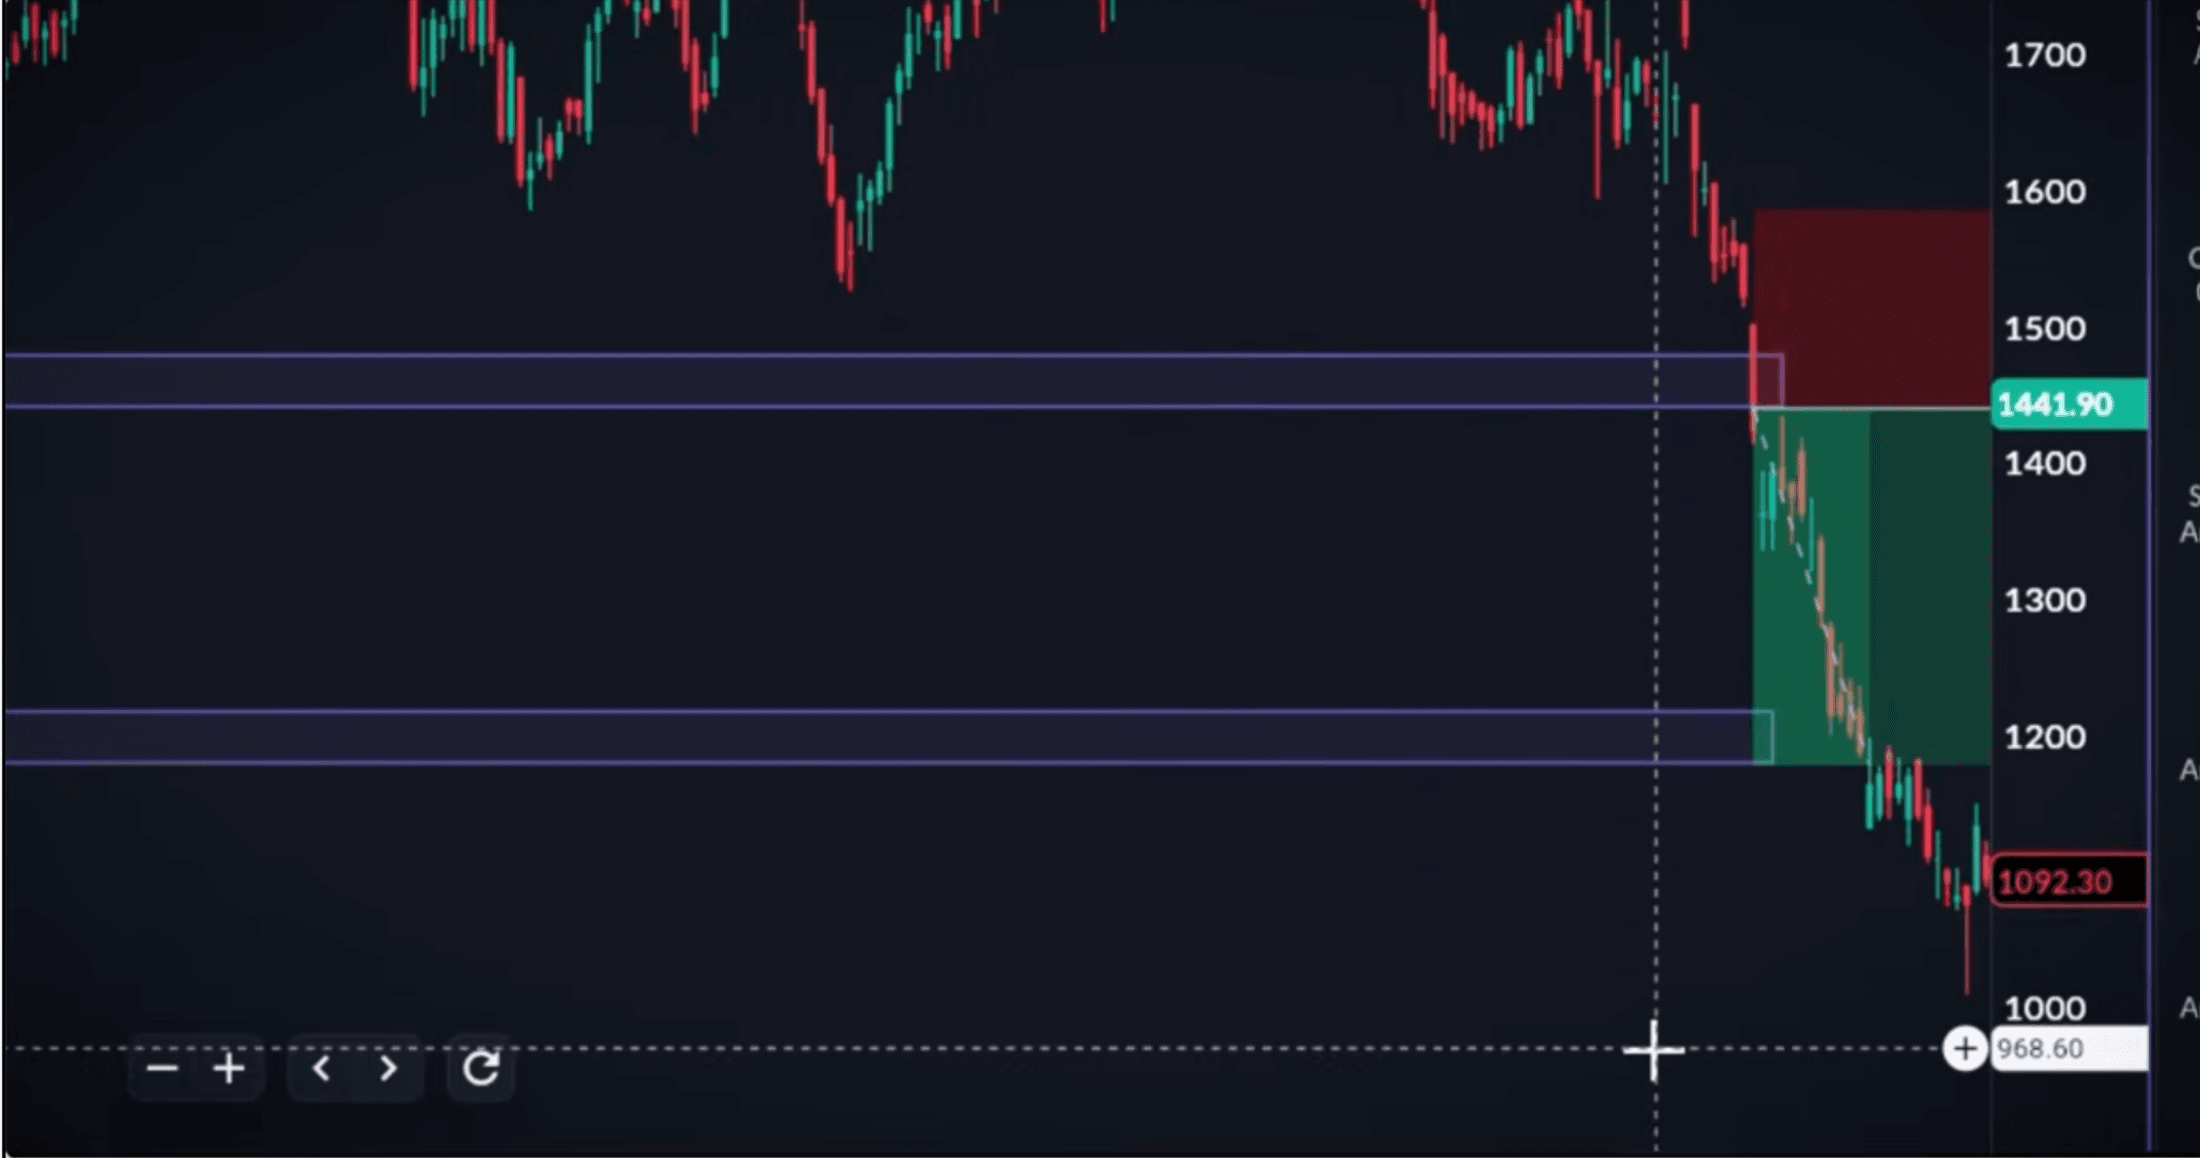
Look, what happens in trading is that one trader may focus on the most recent price reaction.
Another may look at a level from three months ago.
A third trader may completely ignore both and draw a broader zone instead of a precise line.
The challenge with support and resistance isn't understanding the concept.
It's deciding which levels actually matter.
Imagine a stock approaching what appears to be an important support level. The price reaches the level, pauses briefly and then breaks lower.
A trader who entered a short trade on that breakdown might expect the price to stop at the next visible support.
Instead, the stock keeps falling.
Looking back, it becomes clear that there was another stronger support zone further below - one that had been tested multiple times in the past but was easy to miss while focusing on recent price action.
That happens more often than traders like to admit.
This is where SAHI's AI-based Key Levels indicator comes in. To see how it works, let's apply the indicator to the chart we were looking at earlier and use it to identify the support levels.
Since we're looking for historically strong support levels, we can increase the pivot memory.
After this, you'll notice that the exact point where the price reversal took place is the same point where the support zone was marked.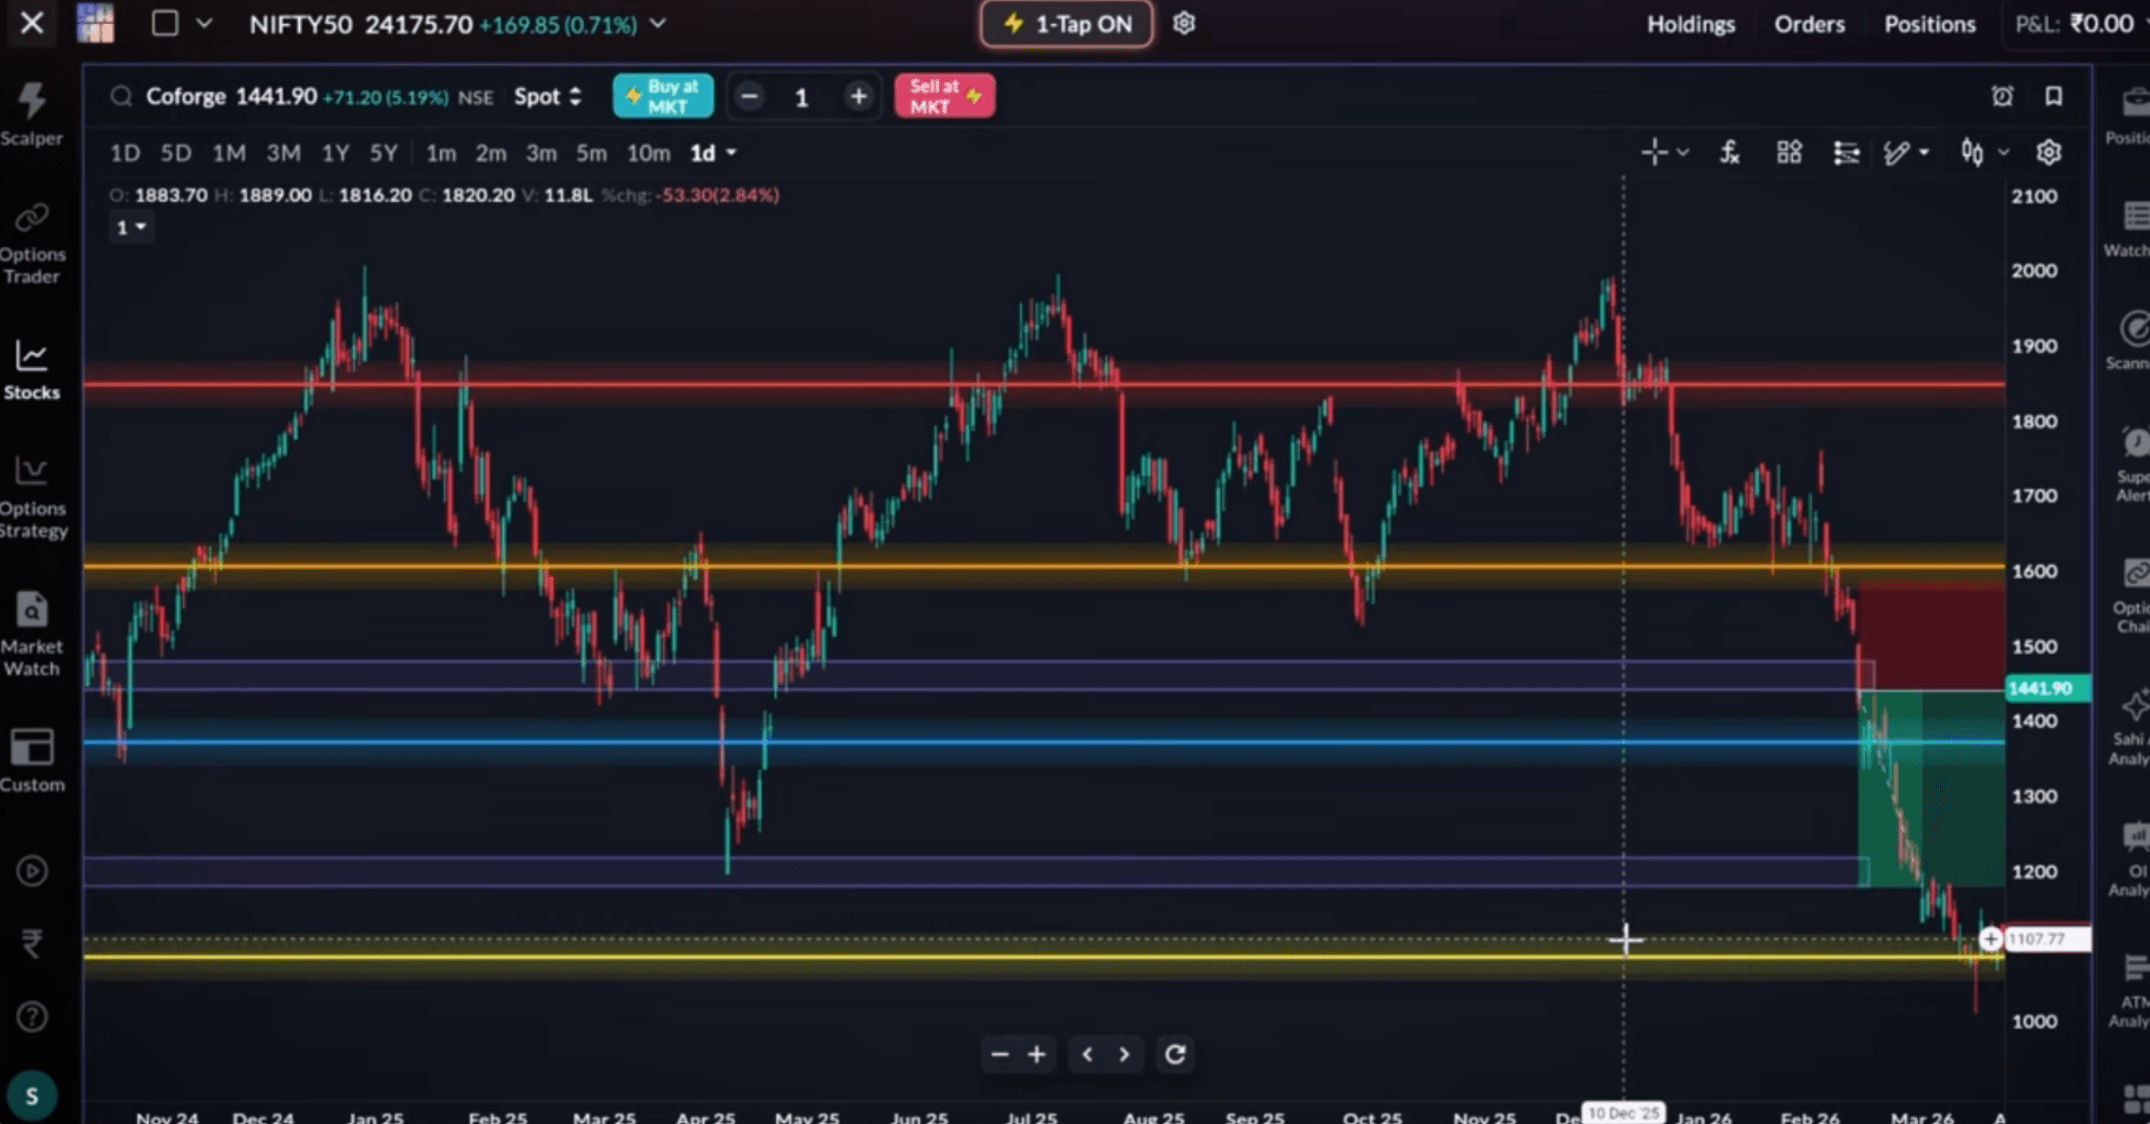
Instead of relying only on recent candles, it scans historical price action and identifies levels that have seen multiple retests over time. A level with four separate touchpoints often carries more significance than a level that has only been respected once.
The interesting part isn't that traders couldn't identify those levels manually.
They absolutely could.
The difference is that machines don't get tired, don't rush through charts and don't suffer from recency bias.
They simply process the data.
When Chart Patterns Start Looking Familiar
Experienced traders often talk about pattern recognition.
After looking at charts for years, they begin noticing similarities between current setups and situations they have seen before.
A breakout starts looking familiar. A reversal structure feels familiar. A momentum shift reminds them of previous moves.
Machine learning tries to do something very similar.
Only faster.
Watch the video on this here:
https://www.youtube.com/watch?v=H7ckB7ZqlUc
One of the AI indicators available inside SAHI's terminal is based on something called Lorentzian Classification.
The idea behind it is fairly simple.
The model studies thousands of historical chart structures and attempts to identify whether current market conditions resemble bullish or bearish environments from the past.
Instead of merely producing a buy or sell signal, it tries to measure the strength of market momentum as well. Let's understand how this will work practically.
Open the chart of any stock you want to analyse, and simply select the 'Lorentzian Classification' indicator.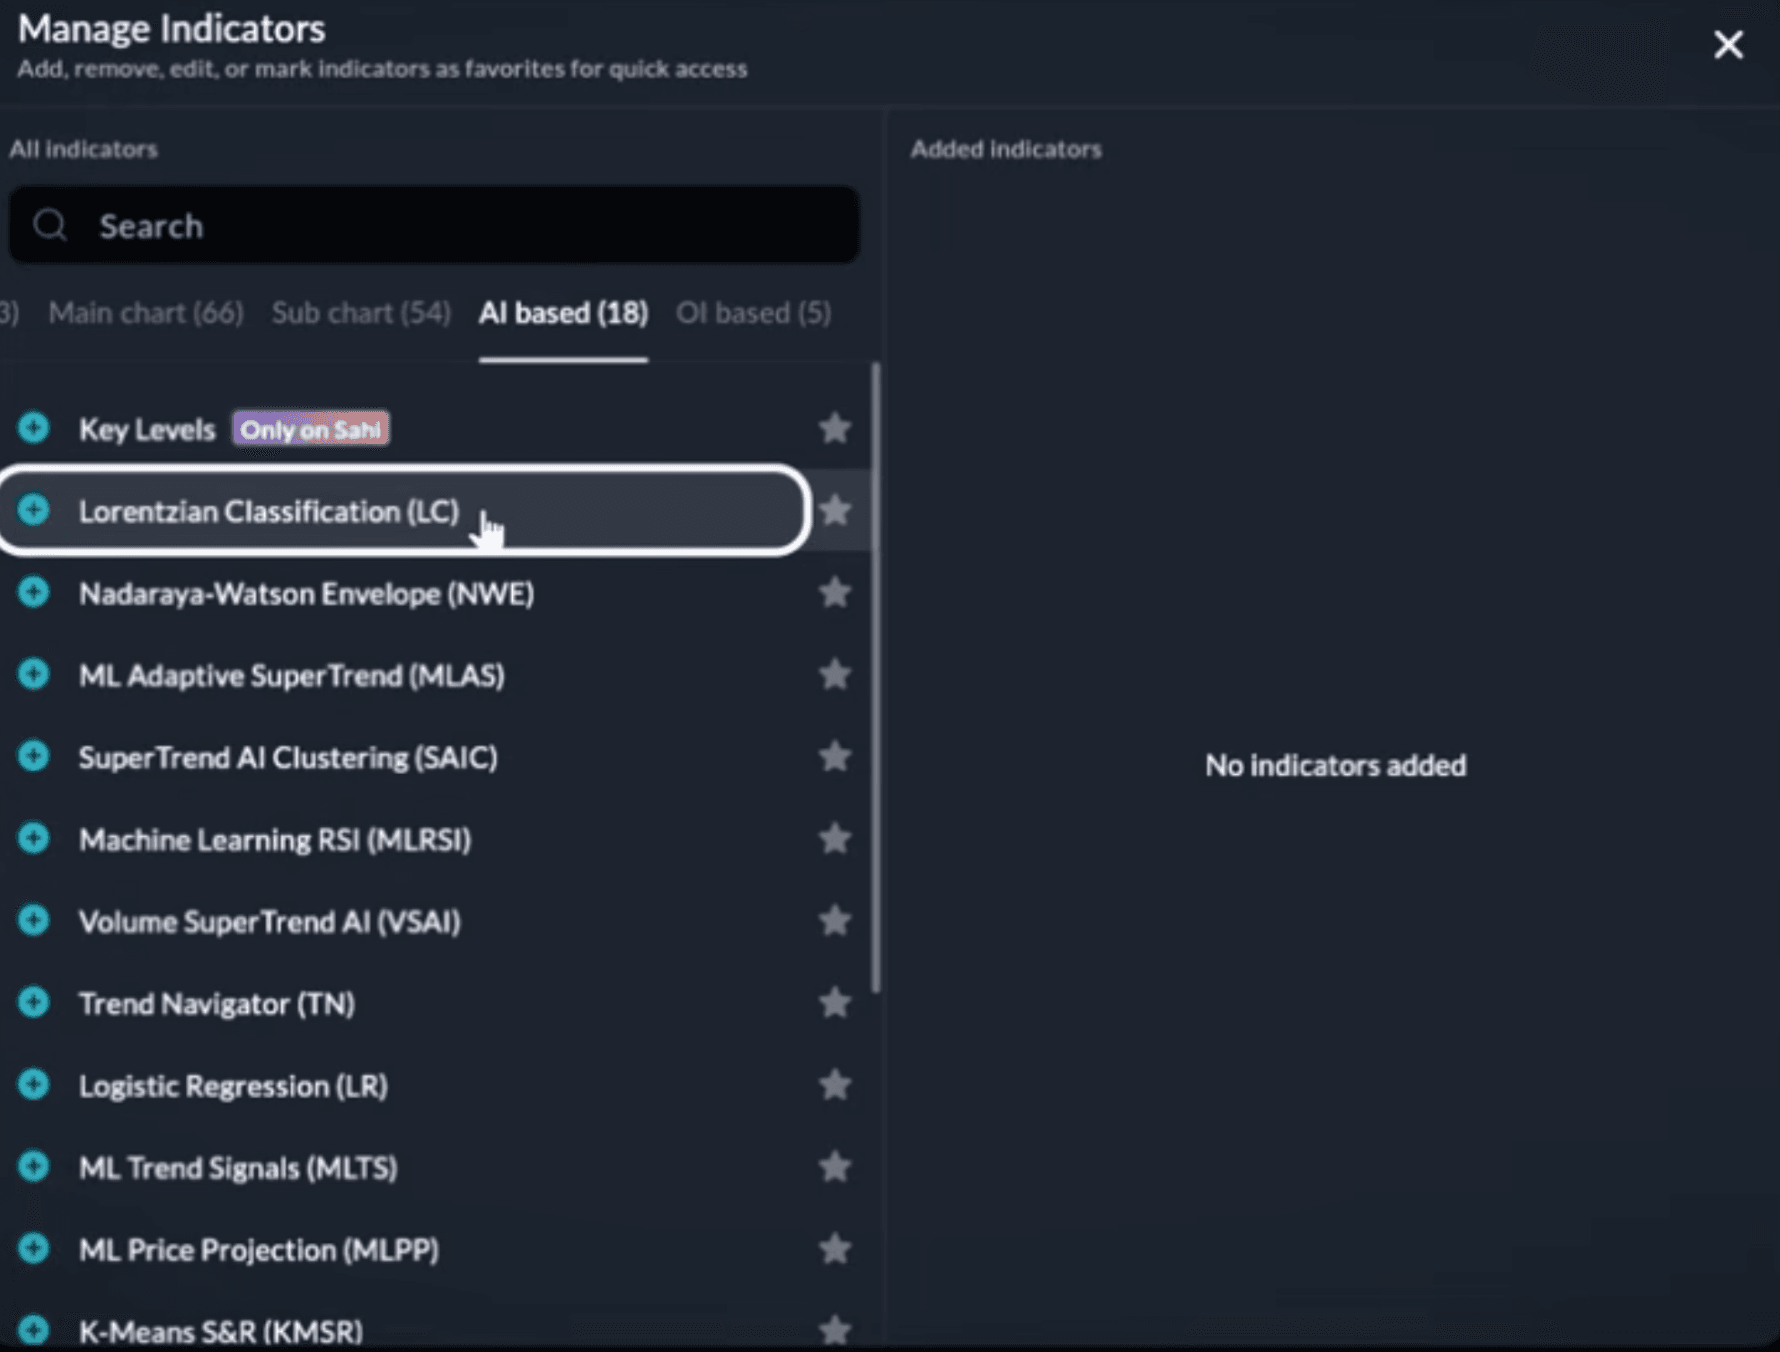
Now, you can see that the green and red lines indicate whether the market is bullish or bearish, respectively.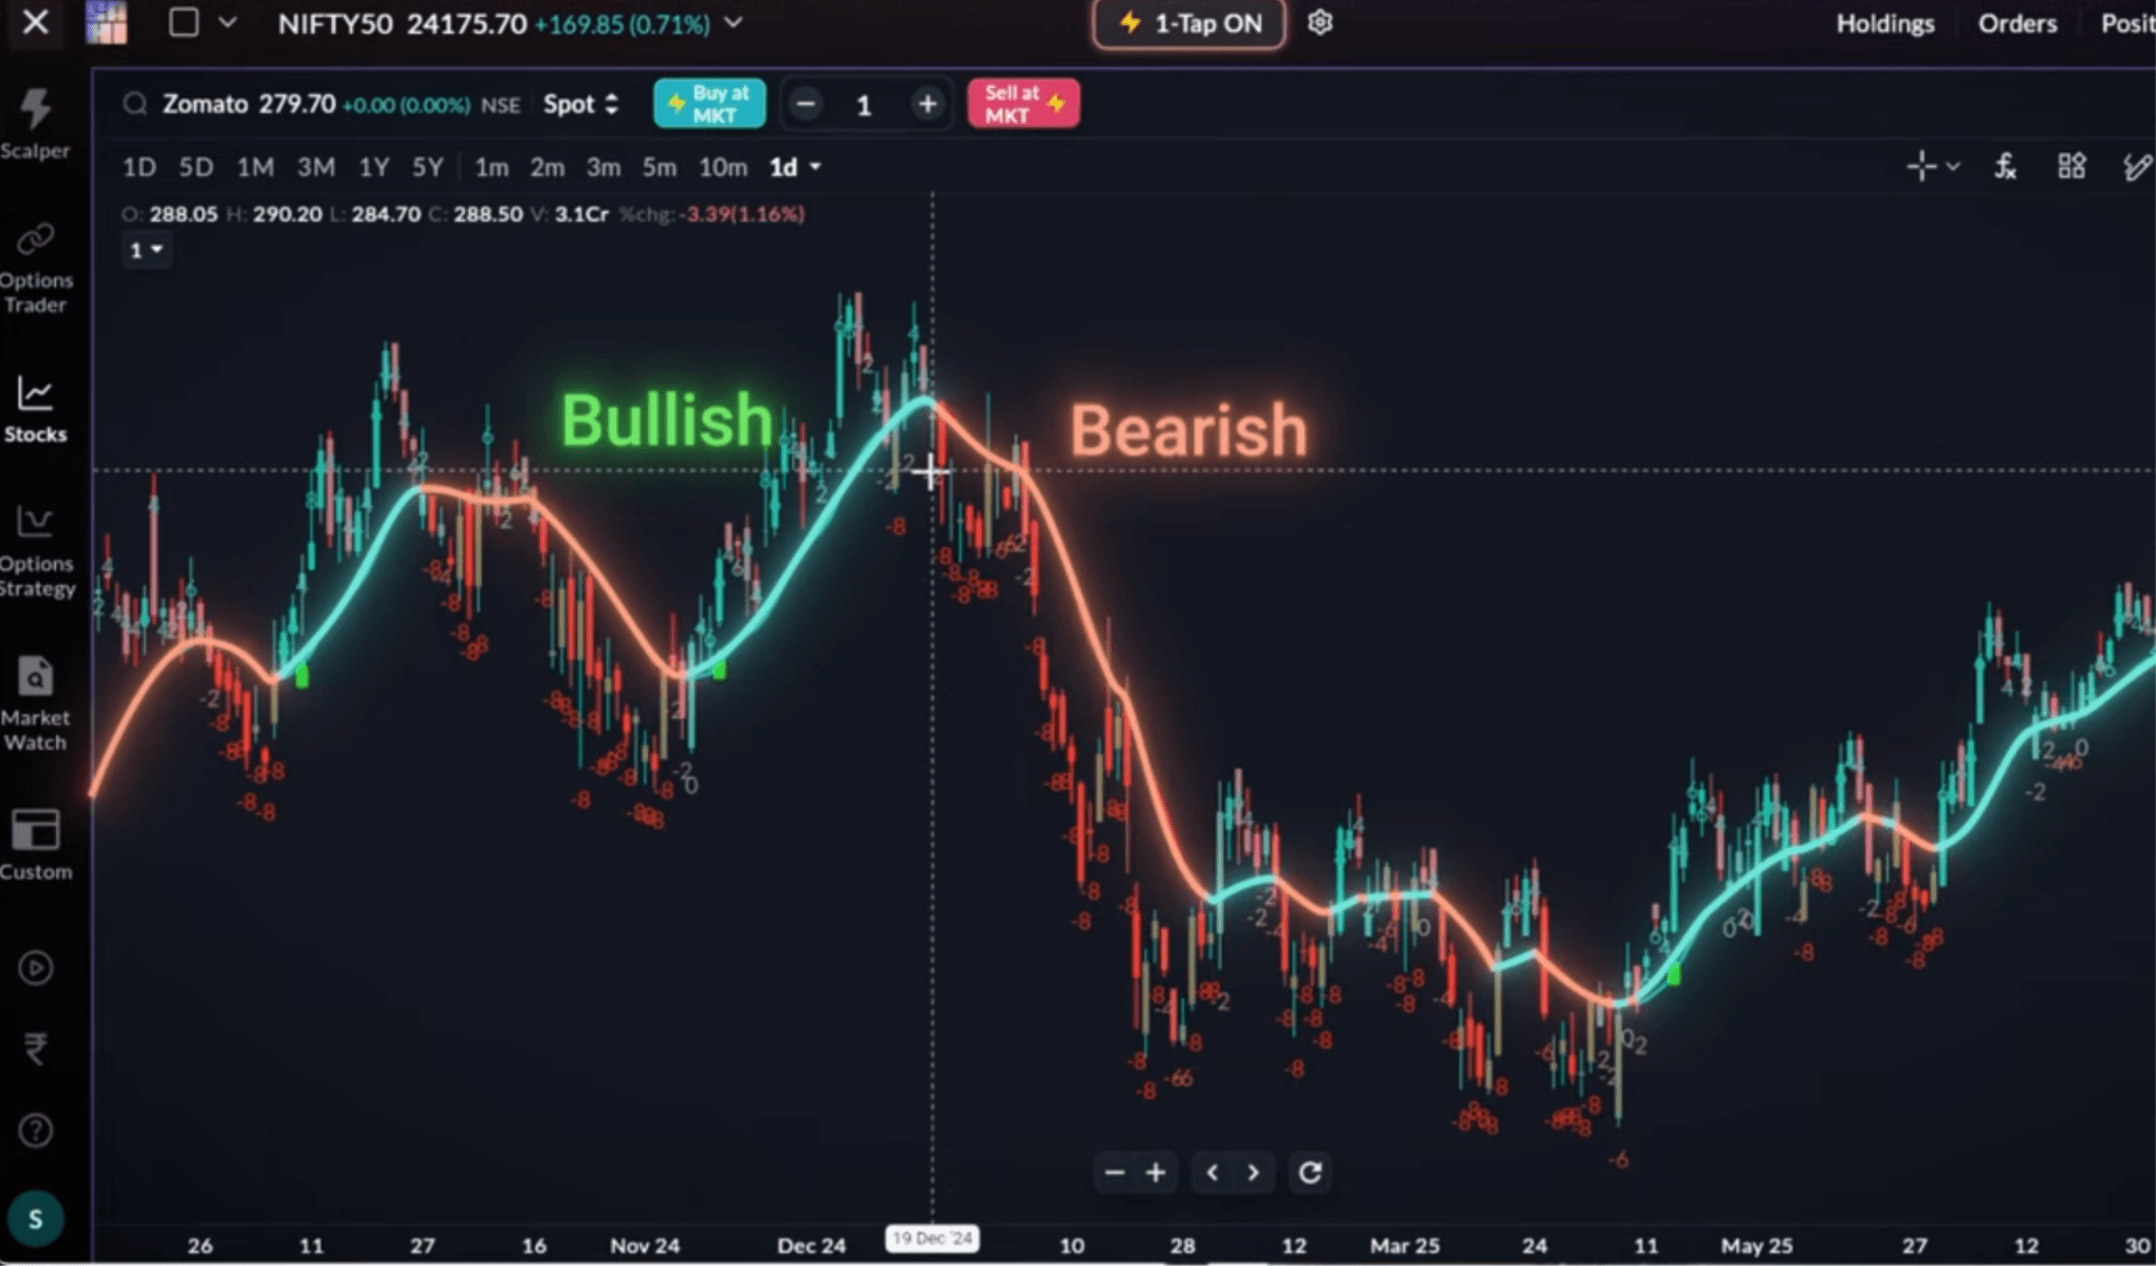
The interesting part is that this indicator doesn't just tell you whether the market is bullish or bearish - it also gives you an idea of how strong that momentum is. If you look at the chart below, you'll notice that each candle is assigned a number. A reading of -8 indicates strongly bearish momentum, while +8 suggests strongly bullish momentum.
And the green envelope you see here is a buy signal, which suggests that the indicator considers this a favourable point for a potential entry. But, just after seeing this green envelope, you should not take the trade. We have to look for three things.
- The kernel line should be blue.
- Price should be above the kernel line.
- There should be a green envelope.
Once all these conditions are met, the trade is taken at the close of the candlestick, with the stop-loss placed slightly below it and the target set at a 1:1.5 risk-reward ratio.
However, it's important to note that during periods of high volatility, this indicator can sometimes generate buy signals even in a downtrend, which may lead to the stop-loss being triggered. In simple terms, while Lorentzian Classification can help you understand how bullish or bearish a chart is, the Machine Learning Adaptive Supertrend can give you a better sense of how much the chart is likely to fluctuate.
The Market's Mood Changes Every Day
There is one factor traders often underestimate.
Volatility.
A strategy that works beautifully in a fast-moving market can struggle badly in a slow and range-bound one. Similarly, strategies designed for calm markets can become difficult to manage during highly volatile sessions.
The market may be moving in the right direction.
It may simply be getting there in a completely different manner than expected.
That is why understanding volatility matters almost as much as understanding direction.
Why SAHI Built An AI-Powered Supertrend
Traditional Supertrend indicators have been popular among traders for years because they help identify market direction.
The limitation is that trends alone don't tell the entire story.
A stock moving 2% a day behaves very differently from one moving 8% a day.
SAHI's Machine Learning Adaptive Supertrend attempts to address that gap by incorporating volatility analysis alongside trend identification. The model analyses recent market behaviour and classifies volatility conditions rather than simply showing whether the market is trending higher or lower. Let's see how this indicator works.
Once you apply this indicator, you'll notice a table appear on the screen. Whenever it detects high volatility, it assigns a value of 3, while low volatility is marked as 1.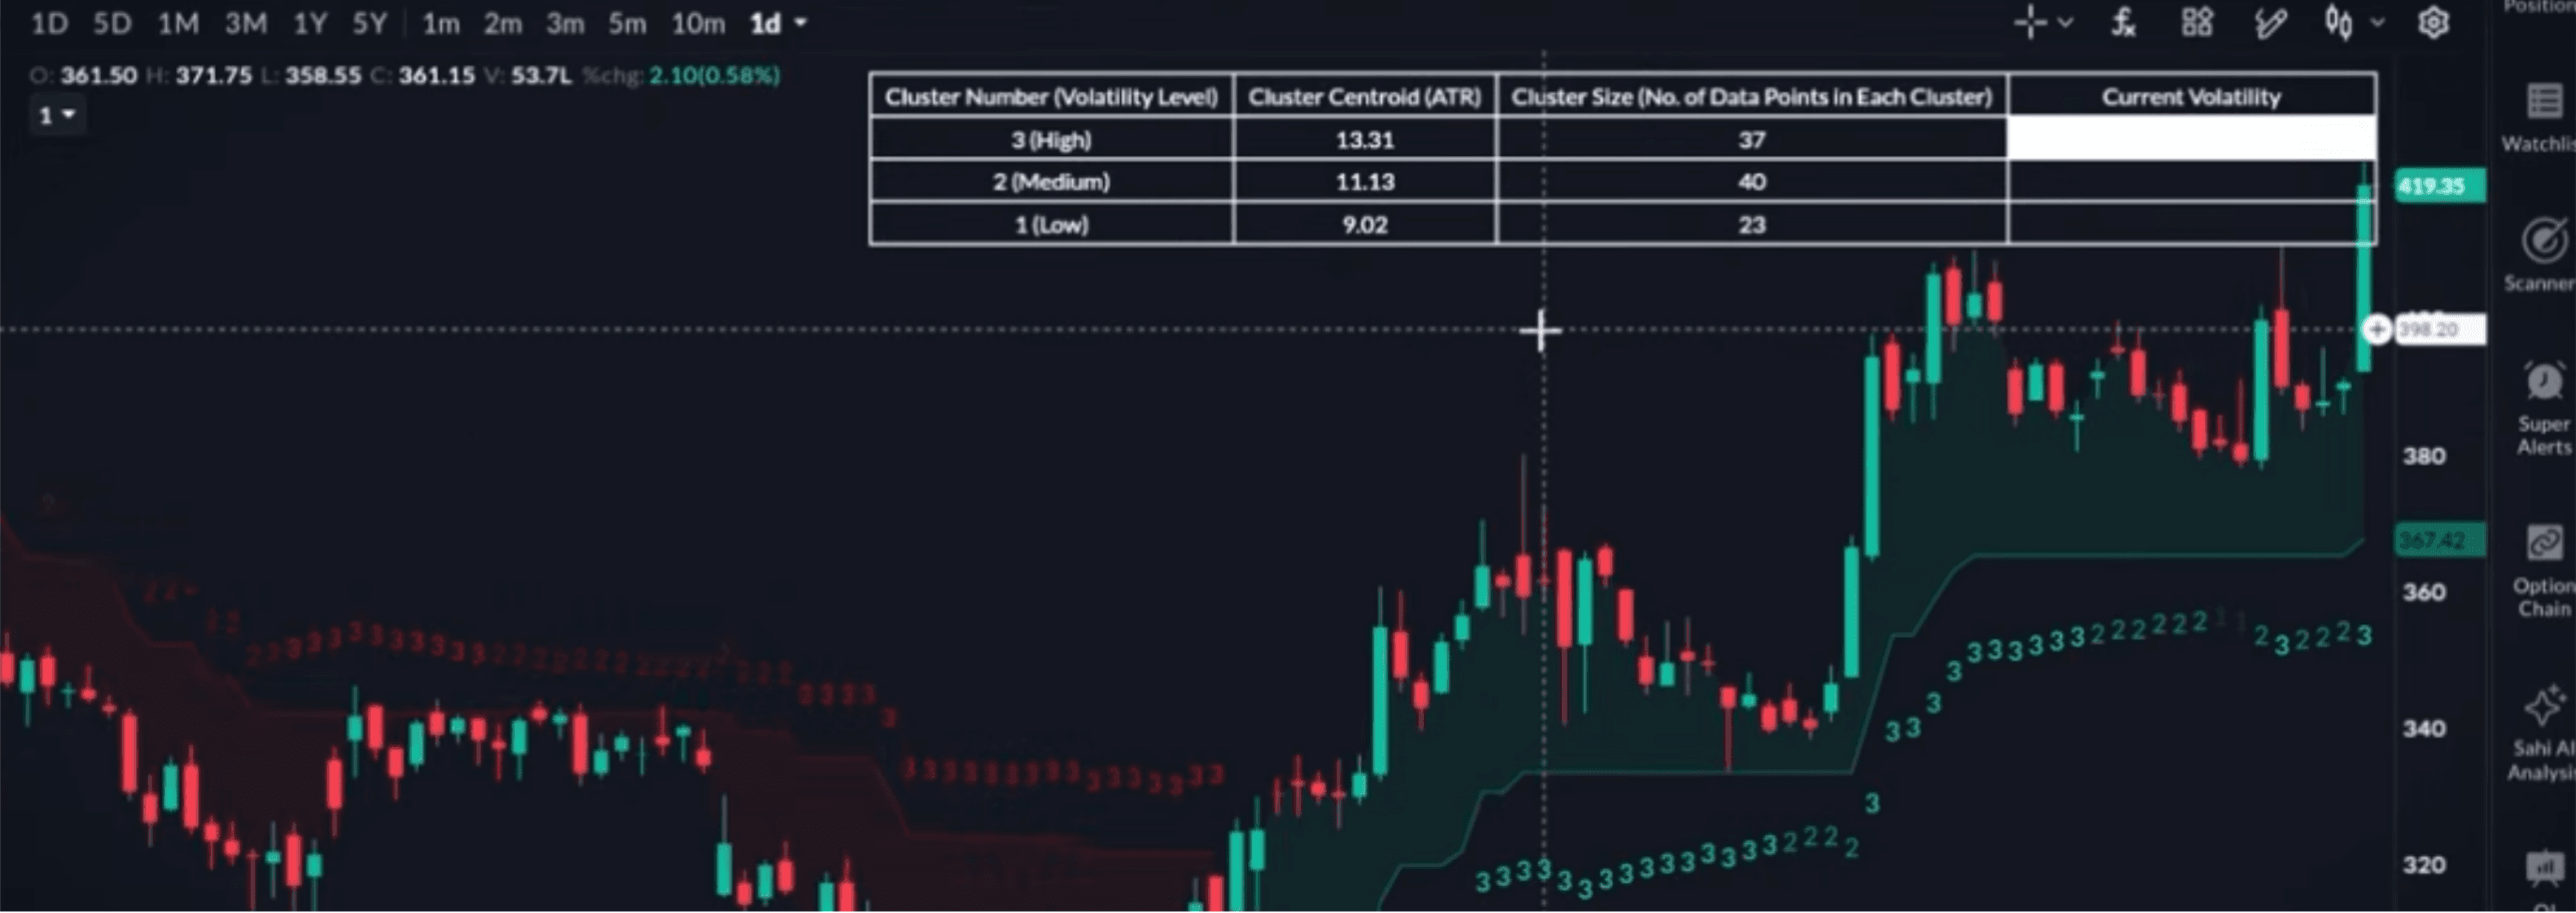
High-volatility environments receive different classifications from low volatility environments.
That information can influence how traders approach a particular stock or setup.
For example, highly volatile stocks often attract short-term traders looking for larger price swings. Lower volatility names may appeal to traders looking for smoother trends and fewer sharp reversals.
Neither environment is inherently better.
They're simply different.
The important thing is knowing which environment you're operating in.
The Real Value of AI in Trading
The biggest question around AI is whether it will replace humans.
In trading, it looks more like an assistant than a replacement.
AI can scan charts faster, identify key levels, spot patterns, and measure momentum or volatility in seconds. The trader still makes the final decision.
Perhaps its biggest advantage isn't accuracy, but time - less time spent marking charts manually and more time spent making decisions.
That's exactly what AI-powered indicators aim to achieve: reducing the effort involved in analysis and helping traders focus on what matters most.
The real value of AI in trading may not lie in replacing human judgement, but in helping it work with better information.
Disclaimer: This article is intended purely for educational and informational purposes and should not be interpreted as investment or trading advice. Trading and investing involve market risks, and outcomes are never guaranteed.
Frequently Asked Questions (FAQs)
All topics
Click the link, confirm the box next to sahi.com is checked — ignore any other results.