
Trent Q1 Results 2027: Revenue Rises 18% YoY, PAT Jumps 22% to ₹518 Cr
Trent posted strong Q1 FY27 results with double-digit growth in revenue and profit, supported by higher operating efficiency and improved EBITDA margin.

Trent Q1 Results FY2027: Trent reported a strong performance in Q1 FY27, supported by robust revenue growth and improved operating efficiency. Higher operating leverage led to margin expansion, resulting in healthy growth in profitability during the quarter.
Trent Q1 Results FY2027: On 6 August 2026, Trent announced its financial results for the first quarter ended 30 June 2026. Revenue from Operations increased 17.84% YoY to ₹5,755 crore compared with ₹4,883 crore in Q1 FY26.
While Profit After Tax (PAT) increased 21.98% YoY to ₹518 crore compared with ₹425 crore in Q1 FY26. EBITDA Margin stood at 19.62% during the quarter.
Trent share price is trading 0.54% higher on 6 August 2026 at the time of writing this article . The stock has delivered 10% returns year-to-date and -12% returns over the one-year period from 6 August 2025 to 6 August 2026.
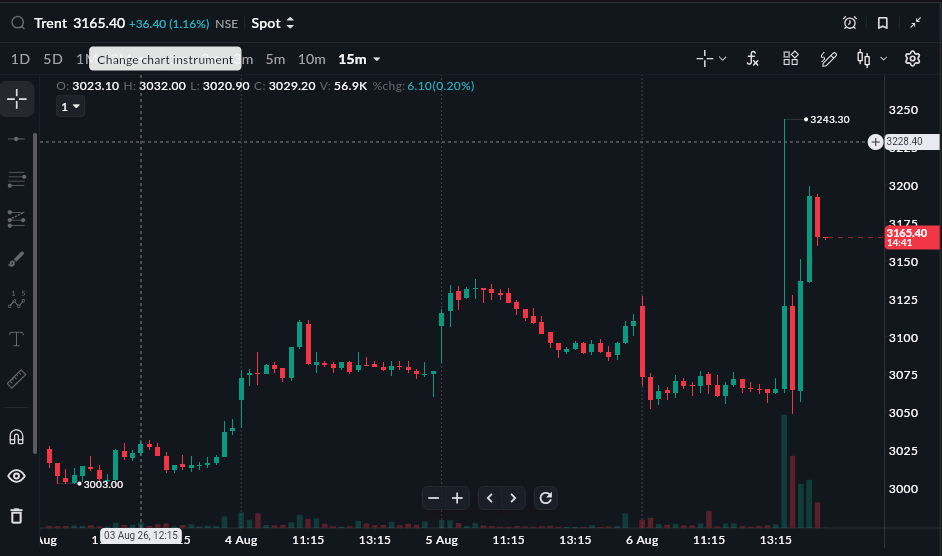
As of 6 Aug, 2:45 PM
READ THIS: Bajaj Auto vs TVS Motor
Trent Q1 FY27 Results Highlights
-
Revenue from Operations stood at ₹5,755 crore, registering a 17.84% YoY increase from ₹4,883 crore in Q1 FY26. Compared with ₹5,028 crore in Q4 FY26, revenue increased 14.45% QoQ.
-
Total Revenue stood at ₹5,785 crore, registering a 17.47% YoY increase from ₹4,924 crore in Q1 FY26. Compared with ₹5,056 crore in Q4 FY26, total revenue increased 14.41% QoQ.
-
EBITDA (Excluding Other Income) stood at ₹1,129 crore, compared with ₹848 crore in Q1 FY26, registering a 33.15% YoY increase. Compared with ₹927 crore in Q4 FY26, EBITDA increased 21.73% QoQ.
-
EBITDA Margin stood at 19.62%, compared with 17.36% in Q1 FY26 and 18.44% in Q4 FY26, improving by 2.26 percentage points YoY and 1.17 percentage points QoQ.
-
Profit After Tax (PAT) stood at ₹518 crore, compared with ₹425 crore in Q1 FY26, registering a 21.98% YoY increase. Compared with ₹413 crore in Q4 FY26, PAT increased 25.41% QoQ.
-
PAT Margin stood at 9.00%, compared with 8.70% in Q1 FY26 and 8.22% in Q4 FY26, improving by 0.31 percentage points YoY and 0.79 percentage points QoQ.
-
Profit After Tax attributable to owners of the company stood at ₹519 crore, compared with ₹430 crore in Q1 FY26, registering a 20.79% YoY increase. Compared with ₹400 crore in Q4 FY26, PAT attributable to owners increased 29.65% QoQ.
-
EPS stood at ₹9.73, compared with ₹8.06 in Q1 FY26 and ₹7.51 in Q4 FY26, increasing 20.72% YoY and 29.56% QoQ.
|
Metric |
Q1 FY27 |
Q4 FY26 |
QoQ % |
Q1 FY26 |
YoY % |
|---|---|---|---|---|---|
|
Revenue from Operations (₹ Cr) |
5,755 |
5,028 |
14.45% |
4,883 |
17.84% |
|
Total Revenue (₹ Cr) |
5,785 |
5,056 |
14.41% |
4,924 |
17.47% |
|
EBITDA (Excl. Other Income) (₹ Cr) |
1,129 |
927 |
21.73% |
848 |
33.15% |
|
EBITDA Margin |
19.62% |
18.44% |
+1.17 pp |
17.36% |
+2.26 pp |
|
PAT (₹ Cr) |
518 |
413 |
25.41% |
425 |
21.98% |
|
PAT Margin |
9.00% |
8.22% |
+0.79 pp |
8.70% |
+0.31 pp |
|
PAT (Owners) (₹ Cr) |
519 |
400 |
29.65% |
430 |
20.79% |
|
EPS (₹) |
9.73 |
7.51 |
29.56% |
8.06 |
20.72% |
Source: Company Filing
All topics
Click the link, confirm the box next to sahi.com is checked — ignore any other results.