
Tech Mahindra Q1 Results 2027: PAT Rises 32% YoY, Revenue Grows 18%
Tech Mahindra reported a strong Q1 FY27 performance with double-digit growth in revenue and profit. The company's IT and BPS businesses delivered healthy growth, while operating margins improved during the quarter.

Tech Mahindra reported a strong Q1 FY27 performance, with revenue from operations rising 17.68% YoY to ₹15,711.90 crore and PAT increasing 31.67% to ₹1,486.30 crore. The company also posted healthy growth in operating profit and improved margins during the quarter.
Tech Mahindra Q1 Results 2027: On 16 July, Tech Mahindra reported a strong performance for the first quarter of FY27, as revenue from operations grew 17.68% YoY to ₹15,711.90 crore, while profit after tax (PAT) surged 31.67% YoY to ₹1,486.30 crore.
The company also reported healthy growth in operating profit and improved margins, reflecting a strong start to the new financial year. Here is a detailed breakdown of TechM Q1 FY27 results.
Tech Mahindra Q1 2027 Results Highlights
-
Tech Mahindra reported revenue from operations of ₹15,711.90 crore in Q1 FY27, registering 17.68% YoY growth from ₹13,351.20 crore in the same quarter last year. Revenue from operations increased 4.22% from Q4 FY26.
-
Total revenue stood at ₹15,605.50 crore, up 15.00% YoY from ₹13,569.50 crore. Compared with the March quarter, total revenue increased 4.94%.
-
EBITDA came in at ₹2,742.50 crore, compared with ₹1,935.20 crore in the year-ago quarter, reflecting 41.72% YoY growth. EBITDA increased 6.91% from Q4 FY26.
-
EBITDA margin stood at 17.45%, compared with 14.49% in Q1 FY26 and 17.02% in Q4 FY26.
-
Profit After Tax stood at ₹1,486.30 crore, up 31.67% YoY. PAT increased 9.58% from Q4 FY26.
-
EPS rose to ₹16.53, compared with ₹12.87 in the same quarter last year and ₹15.27 in Q4 FY26,
|
Metric |
Q1 FY27 |
Q4 FY26 |
QoQ Change |
Q1 FY26 |
YoY Change |
|---|---|---|---|---|---|
|
Revenue from Operations (₹ Cr) |
15,711.90 |
15,076.10 |
4.22% |
13,351.20 |
17.68% |
|
Total Revenue (₹ Cr) |
15,605.50 |
14,871.40 |
4.94% |
13,569.50 |
15.00% |
|
EBITDA (₹ Cr) |
2,742.50 |
2,565.30 |
6.91% |
1,935.20 |
41.72% |
|
EBITDA Margin (%) |
17.45% |
17.02% |
+43bps |
14.49% |
+296bps |
|
Profit After Tax (₹ Cr) |
1,486.30 |
1,356.40 |
9.58% |
1,128.80 |
31.67% |
|
PAT Margin (%) |
9.46% |
9.00% |
+46 bps |
8.45% |
+101 bps |
|
EPS (₹) |
16.53 |
15.27 |
8.25% |
12.87 |
28.44% |
Source: Tech Mahindra Q1 FY27 Consolidated Financial Results.
READ THIS ALSO: Wipro Q1 FY27 Results
Tech Mahindra Q1 Segment-wise Revenue
The company's IT and BPS businesses recorded healthy growth during the quarter. While the IT segment remained the biggest revenue contributor, the BPS segment also delivered strong year-on-year growth.
|
Segment |
Q1 FY27 (₹ Cr) |
Q4 FY26 (₹ Cr) |
QoQ Change |
Q1 FY26 (₹ Cr) |
YoY Change |
|---|---|---|---|---|---|
|
IT |
13,245.00 |
12,660.80 |
4.61% |
11,263.00 |
17.60% |
|
BPS |
2,466.90 |
2,415.30 |
2.22% |
2,087.50 |
18.27% |
|
Total |
15,711.90 |
15,076.10 |
4.22% |
13,351.20 |
17.68% |
Tech Mahindra Share price today
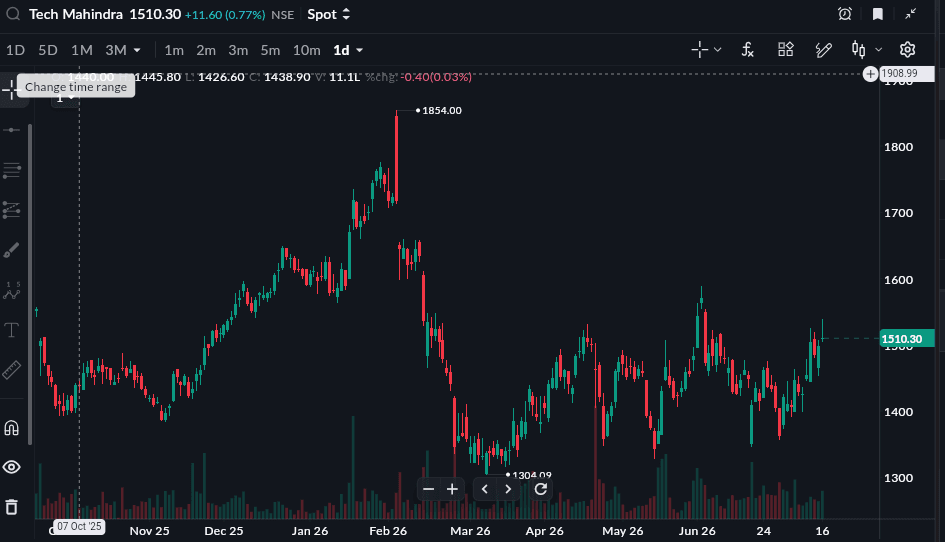
As of 16th July 2026, 3.30PM
Tech Mahindra shares closed at ₹1,515.60 on the NSE, up 1.13% in Thursday's trading session. Despite the recent recovery, Tech Mahindra shares are down about 5.73% and 5.74% in YTD and over the last 1 year.
All topics
Click the link, confirm the box next to sahi.com is checked — ignore any other results.