
Tata Chemicals Q1 Results 2027: Revenue Grows 14% YoY; PAT Declines 81%
Tata Chemicals reported double-digit revenue growth in Q1 FY27, but weaker operating margins and lower profitability led to a sharp decline in quarterly earnings despite a sequential turnaround.

Tata Chemicals Q1 Results 2027: Tata Chemicals reported a mixed Q1 FY27 performance, with revenue from operations increasing 14.41% YoY to ₹4,255 crore. However, Profit After Tax (PAT) declined 81.01% YoY to ₹60 crore despite a sharp sequential recovery from the loss reported in the previous quarter.
Tata Chemicals Q1 Results FY2027: After announcing its Q1 FY27 results on 27 July, Tata Chemicals shares opened lower on 28 July. At 9:50 AM, the stock was trading more than 3% below its previous day's closing price.
TATA Chemicals share price closed at 698.90 (+1.98%) on 27 July 2026. The stock is down 9.68% year-to-date and down 28.54% in one year from 28 July 2025 to 28 July 2026
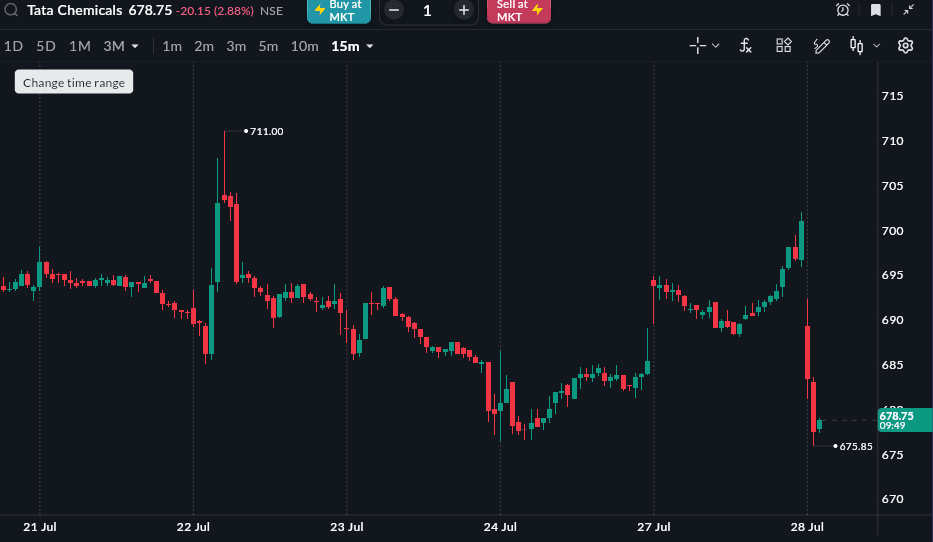
As of 28 July, 9:50 AM
READ THIS ALSO: Xtranet Technologies IPO Allotment Status
Tata Chemicals Q1 FY27 Results Highlights
-
Revenue from Operations increased to ₹4,255 crore, up 14.41% YoY from ₹3,719 crore. Compared with ₹3,438 crore in Q4 FY26, revenue increased 23.76% QoQ.
-
Total Revenue stood at ₹4,311 crore in Q1 FY27, registering a 13.00% YoY increase from ₹3,815 crore in Q1 FY26. Compared with ₹3,482 crore in Q4 FY26, total revenue increased 23.81% QoQ.
-
EBITDA (Excluding Other Income) stood at ₹555 crore, declining 14.48% YoY from ₹649 crore. Compared with ₹274 crore in Q4 FY26, EBITDA increased 102.55% QoQ.
-
EBITDA Margin stood at 13.04%, compared with 17.45% in Q1 FY26 and 7.97% in Q4 FY26, declining by 4.41 percentage points YoY while improving by 5.07 percentage points QoQ.
-
Profit After Tax (PAT) stood at ₹60 crore, declining 81.01% YoY from ₹316 crore. Compared with a loss of ₹2,116 crore in Q4 FY26, the company returned to profitability.
-
PAT Margin stood at 1.41%, compared with 8.50% in Q1 FY26 and -61.55% in Q4 FY26.
-
Earnings Per Share (EPS) stood at a loss of ₹6.70, compared with a loss of ₹83.68 in Q4 FY26 and ₹9.89 in Q1 FY26.
|
Metric |
Q1 FY27 |
Q4 FY26 |
QoQ % |
Q1 FY26 |
YoY % |
|---|---|---|---|---|---|
|
Revenue from Operations (₹ Cr) |
4,255 |
3,438 |
23.76% |
3,719 |
14.41% |
|
Total Revenue (₹ Cr) |
4,311 |
3,482 |
23.81% |
3,815 |
13.00% |
|
EBITDA (₹ Cr) |
555 |
274 |
102.55% |
649 |
-14.48% |
|
EBITDA Margin |
13.04% |
7.97% |
5.07% |
17.45% |
-4.41% |
|
PAT (₹ Cr) |
60 |
-2,116 |
Turnaround |
316 |
-81.01% |
|
PAT Margin |
1.41% |
-61.55% |
62.96% |
8.50% |
-7.09% |
|
EPS (₹) |
-6.70 |
-83.68 |
-91.99% |
9.89 |
-167.75% |
Source: Tata Chemicals Q1 FY27 Financial Results.