
Sun Pharma Q1 Results 2027: PAT Jumps 27%, Revenue Up 10%
Sun Pharma reported a strong Q1 FY27, with consolidated revenue rising 10.46% YoY to ₹15,299.88 crore and net profit increasing 27.04% to ₹2,894.79 crore.

Sun Pharma Q1 Results 2027: Sun Pharma reported a strong Q1 FY27, with consolidated revenue rising 10.46% YoY to ₹15,299.88 crore and net profit increasing 27.04% to ₹2,894.79 crore. India formulations business grew 16%, while EBITDA margin narrowed due to one-time acquisition and labour-related costs.
Sun Pharma Q1 Results 2027: On 31 July 2026, Sun Pharma reported its Q1 FY27 results, with consolidated profit rising 27% year-on-year to ₹2,894.79 crore, while total income increased 10.46% YoY to ₹15,299.88 crore.
Following the Q1 FY27 results, Sun Pharma shares closed 0.70% down. The stock is up 16% over the one year from 31 July 2025 to 31 July 2026.
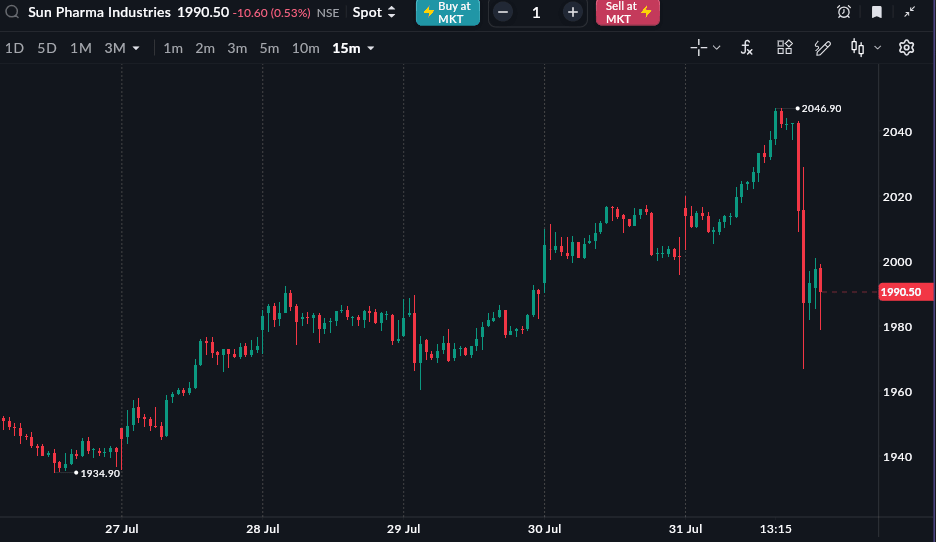
As of 31 July, 3.30 PM
READ THIS ALSO: Kajaria Ceramics Q1 Results 2027
Sun Pharma Q1 FY27 Results Highlights (Consolidated)
-
Consolidated revenue from operations came in at ₹15,300 crore for the June quarter, up 10.5% from ₹13,851 crore in the same quarter last year. On a quarter-on-quarter basis, revenue rose 4.7% from ₹14,612 crore in Q4 FY26.
-
Total income followed a similar trend, rising 11.9% YoY to ₹16,024 crore from ₹14,316 crore, helped by higher other income of ₹724 crore against ₹464 crore a year earlier. Sequentially, total income was up 6.3% from ₹15,070 crore.
-
EBITDA stood at ₹4,418 crore for the quarter, s up 2.7% from ₹4,302 crore in Q1 FY26, and up nearly 12% from ₹3,954 crore in Q4 FY26.
-
EBITDA margin, however, contracted to 28.9% from 31.1% a year earlier, though it improved from 27.1% in the March quarter.
-
Consolidated net profit came in at ₹2,895 crore, up 27% from ₹2,279 crore in Q1 FY26, profit rose 6.7% from ₹2,714 crore in March quarter.
|
Metric |
Q1 FY27 |
Q4 FY26 |
QoQ % |
Q1 FY26 |
YoY % |
|---|---|---|---|---|---|
|
Revenue from Ops (₹ Cr) |
15,299.88 |
14,611.79 |
+4.71% |
13,851.40 |
+10.46% |
|
Total Income (₹ Cr) |
16,023.50 |
15,070.29 |
+6.32% |
14,315.86 |
+11.93% |
|
EBITDA (₹ Cr) |
4,417.67 |
3,954.20 |
+11.72% |
4,301.66 |
+2.70% |
|
EBITDA Margin % |
28.87% |
27.06% |
+181 bps |
31.06% |
-219 bps |
|
PAT (₹ Cr) |
2,894.79 |
2,714.03 |
+6.66% |
2,278.63 |
+27.04% |
|
EPS — Diluted (₹) |
12.1 |
11.3 |
+7.08% |
9.5 |
+27.37% |
Source: NSE filing, Sun Pharma Q1 FY27 Consolidated Financial Results, 31 July 2026
Sun Pharma Business-wise Sales Breakup (Consolidated)
On the business front, the company's India formulations business led the charge, growing 16% YoY to ₹5,475 crore.
|
Business/Geography |
Q1 FY27 (₹ Cr) |
Q1 FY26 (₹ Cr) |
YoY % |
|---|---|---|---|
|
India Formulations |
5,474.89 |
4,721.10 |
+15.97% |
|
US Formulations |
4,041.91 |
4,045.21 |
-0.08%* |
|
EM Formulations |
2,945.63 |
2,553.14 |
+15.38% |
|
ROW Formulations |
2,068.58 |
1,873.59 |
+10.41% |
|
API |
597.23 |
540.37 |
+10.52% |
|
Others |
55.31 |
52.66 |
+5.03% |