
SRF Q1 Results 2027: Revenue Rises 32% YoY, PAT Surges 76%
SRF reported a strong Q1 FY27 with revenue from operations rising to ₹5,033.26 crore and PAT increasing to ₹758.87 crore. Growth across Performance Films & Foil, Chemicals and Technical Textiles supported higher earnings and margin expansion.

SRF Q1 Results FY2027: SRF delivered an impressive Q1 FY27 performance, with revenue rising 32% YoY and PAT surging 76%. Strong growth across the Performance Films & Foil, Chemicals and Technical Textiles businesses drove higher profitability, while operating margins expanded significantly during the quarter.
SRF Q1 Results FY2027: On 22 July, SRF reported a strong performance in the first quarter of FY27, driven by robust growth across its core businesses. Revenue from Operations increased 31.81% year-on-year to ₹5,033.26 crore, while Profit After Tax (PAT) surged 75.53% YoY to ₹758.87 crore, supported by improved operating margins. Here is the detailed SRF Q1 result.
SRF Q1 Results FY2027 Highlights
-
Revenue from Operations stood at ₹5,033.26 crore in Q1 FY27, registering 31.81% YoY growth from ₹3,818.62 crore in Q1 FY26. Compared with ₹4,615.17 crore in Q4 FY26, revenue increased 9.06%.
-
Total Revenue came in at ₹5,067.17 crore, up 31.69% YoY from ₹3,847.74 crore and 9.20% from ₹4,640.07 crore in Q4 FY26.
-
EBITDA (excluding Other Income) increased to ₹1,236.72 crore, compared with ₹829.84 crore in Q1 FY26, reflecting 49.03% YoY growth. Compared with ₹1,025.68 crore in Q4 FY26, EBITDA increased 20.58%. EBITDA Margin stood at 24.57%, compared with 21.73% in Q1 FY26 and 22.22% in Q4 FY26.
-
Profit After Tax (PAT) stood at ₹758.87 crore, up 75.53% YoY from ₹432.32 crore in Q1 FY26. Compared with ₹582.02 crore in Q4 FY26, PAT increased 30.39%.
-
PAT Margin stood at 15.08%, compared with 11.32% in Q1 FY26 and 12.61% in Q4 FY26, improving by 376 basis points YoY and 247 basis points from Q4 FY26.
-
Earnings Per Share (EPS) stood at ₹25.60, compared with ₹14.58 in Q1 FY26, registering 75.58% YoY growth. Compared with ₹19.63 in Q4 FY26, EPS increased 30.41%.
|
Metric |
Q1 FY27 |
Q4 FY26 |
QoQ % |
Q1 FY26 |
YoY % |
|---|---|---|---|---|---|
|
Revenue from Operations (₹ Cr) |
5,033.26 |
4,615.17 |
9.06% |
3,818.62 |
31.81% |
|
Total Revenue (₹ Cr) |
5,067.17 |
4,640.07 |
9.20% |
3,847.74 |
31.69% |
|
EBITDA (₹ Cr) |
1,236.72 |
1,025.68 |
20.58% |
829.84 |
49.03% |
|
EBITDA Margin |
24.57% |
22.22% |
+235 bps |
21.73% |
+284 bps |
|
PAT (₹ Cr) |
758.87 |
582.02 |
30.39% |
432.32 |
75.53% |
|
PAT Margin |
15.08% |
12.61% |
+247 bps |
11.32% |
+376 bps |
|
EPS (₹) |
25.60 |
19.63 |
30.41% |
14.58 |
75.58% |
Source: SRF Q1 FY27 Financial Results.
SRF Segment-wise Performance Q1 FY27
SRF delivered broad-based growth across its business segments during the quarter, with the Performance Films & Foil Business emerging as the strongest contributor to growth. The Chemicals Business remained the company's largest revenue segment despite remaining largely flat compared with Q4 FY26, while the Technical Textiles Business continued to post healthy double-digit growth.
|
Segment |
Q1 FY27 |
Q4 FY26 |
QoQ % |
Q1 FY26 |
YoY % |
|---|---|---|---|---|---|
|
Technical Textiles Business |
596.84 |
482.53 |
23.69% |
466.55 |
27.93% |
|
Chemicals Business |
2,314.86 |
2,448.33 |
-5.45% |
1,838.95 |
25.88% |
|
Performance Films & Foil Business |
2,016.69 |
1,595.61 |
26.39% |
1,418.20 |
42.20% |
|
Other Businesses |
104.89 |
88.71 |
18.24% |
94.92 |
10.50% |
|
Total |
5,033.28 |
4,615.18 |
9.06% |
3,818.62 |
31.81% |
|
Less: Inter Segment Revenue |
0.02 |
0.01 |
— |
0.00 |
— |
|
Revenue from Operations |
5,033.26 |
4,615.17 |
9.06% |
3,818.62 |
31.81% |
Source: SRF Limited Q1 FY27 Financial Results.
READ THIS ALSO: Adani Green Energy Q1 FY2027 Results
SRF Share Price today
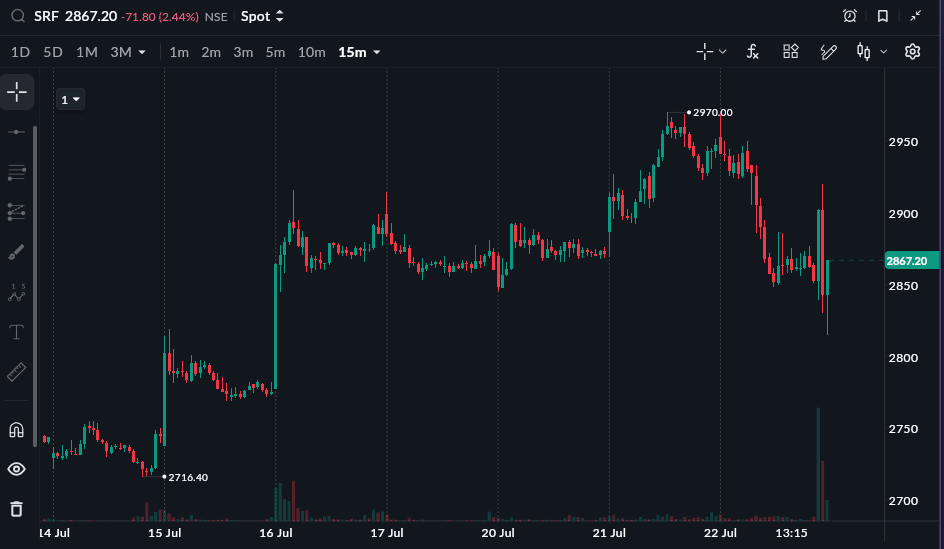
As of 22 July, 3:30 PM
SRF share price closed at 2818.00 (-4.12%) on 22 July 2026. The stock is down 7.83% year-to-date and 10.15% in one year from 22 July 2025 to 22 July 2026
All topics
Click the link, confirm the box next to sahi.com is checked — ignore any other results.