
MTAR Technologies Q1 Results 2027: PAT Surges 365% YoY, Revenue Up 130%
MTAR Technologies reported a strong Q1 FY27 performance, with revenue from operations rising 130.37% YoY and PAT surging 364.57%, while EBITDA margin improved to 23.58%.

MTAR Technologies Q1 Results 2027: MTAR Technologies reported a robust performance for Q1 FY27, with Profit After Tax (PAT) surging to ₹50.22 crore and Revenue from Operations rising to ₹360.71 crore. The company also delivered strong operating leverage, with EBITDA margin expanding by 5.46 percentage points YoY.
MTAR Tech Q1 Results 2027: On 29 July 2026, MTAR Technologies announced its financial results for the first quarter ended June 30, 2026. Revenue from Operations increased 130.37% YoY to ₹360.71 crore, while Profit After Tax (PAT) jumped 364.57% YoY to ₹50.22 crore.
MTAR Technologies shares closed nearly 5% lower ahead of its Q1 FY27 results. MTAR stock has declined 31% over the past month but is still up 116% on a year-to-date basis.
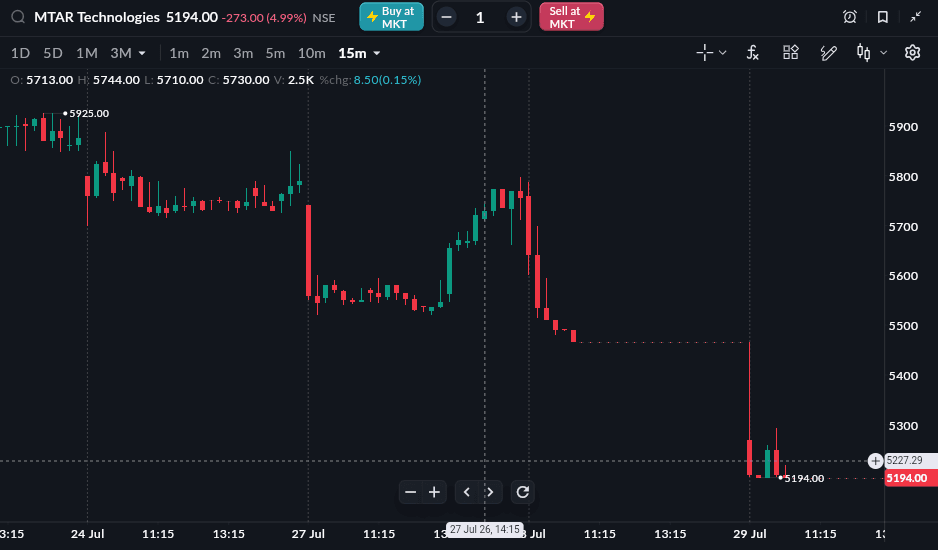
As of 29 July, 3:30 PM
MTAR Technologies Q1 FY27 Results Highlights
-
Revenue from Operations stood at ₹360.71 crore, up 130.37% YoY from ₹156.58 crore. Compared with ₹306.06 crore in Q4 FY26, revenue increased 17.86% QoQ.
-
Total Revenue stood at ₹368.59 crore, registering a 134.49% YoY increase from ₹157.19 crore in Q1 FY26. Compared with ₹322.45 crore in Q4 FY26, total revenue increased 14.31% QoQ.
-
EBITDA (Excluding Other Income) stood at ₹85.04 crore, registering a 199.75% YoY increase from ₹28.37 crore. Compared with ₹61.79 crore in Q4 FY26, EBITDA increased 37.63% QoQ.
-
EBITDA Margin stood at 23.58%, compared with 18.12% in Q1 FY26 and 20.19% in Q4 FY26, improving by 5.46 percentage points YoY and 3.39 percentage points QoQ.
-
Profit After Tax (PAT) stood at ₹50.22 crore, compared with ₹10.81 crore in Q1 FY26, registering a 364.57% YoY increase. Compared with ₹44.28 crore in Q4 FY26, PAT increased 13.41% QoQ.
-
PAT Margin stood at 13.92%, compared with 6.90% in Q1 FY26 and 14.47% in Q4 FY26, improving by 7.02 percentage points YoY while declining by 0.55 percentage points QoQ.
-
EPS stood at ₹16.33, compared with ₹3.52 in Q1 FY26, increasing by ₹12.81 YoY. Compared with ₹14.40 in Q4 FY26, EPS increased by ₹1.93 QoQ.
|
Metric |
Q1 FY27 |
Q4 FY26 |
QoQ % |
Q1 FY26 |
YoY % |
|---|---|---|---|---|---|
|
Revenue from Operations (₹ Cr) |
360.71 |
306.06 |
17.86% |
156.58 |
130.37% |
|
Total Revenue (₹ Cr) |
368.59 |
322.45 |
14.31% |
157.19 |
134.49% |
|
EBITDA (₹ Cr) |
85.04 |
61.79 |
37.63% |
28.37 |
199.75% |
|
EBITDA Margin |
23.58% |
20.19% |
3.39% |
18.12% |
5.46% |
|
PAT (₹ Cr) |
50.22 |
44.28 |
13.41% |
10.81 |
364.57% |
|
PAT Margin |
13.92% |
14.47% |
-0.55% |
6.90% |
7.02% |
|
EPS (₹) |
16.33 |
14.40 |
13.40% |
3.52 |
363.92% |
READ THIS: Waaree Energies Q1 Results 2027
MTAR Technologies Q1 FY27 Segment-wise Revenue
MTAR Technologies reported strong growth across both operating revenue streams during the quarter. Revenue from product sales remained the primary contributor, while other operating revenue also recorded robust double-digit growth on both a sequential and year-on-year basis.
|
Segment Revenue |
Q1 FY27 |
Q4 FY26 |
QoQ % |
Q1 FY26 |
YoY % |
|---|---|---|---|---|---|
|
Sale of Products (₹ Cr) |
355.89 |
302.87 |
17.51% |
154.41 |
130.48% |
|
Other Operating Revenue (₹ Cr) |
4.82 |
3.19 |
51.10% |
2.17 |
122.12% |
|
Total Segment Revenue (₹ Cr) |
360.71 |
306.06 |
17.86% |
156.58 |
130.37% |
Source: MTAR Technologies Q1 FY27 Financial Results.