
Larsen & Toubro Q1 Results 2027: PAT Rises 15.5% YoY; Revenue Grows 6.7%
Larsen & Toubro reported a steady Q1 FY27 performance with higher revenue, double-digit profit growth, and strong order inflows of over ₹1.08 lakh crore, supported by infrastructure and green energy businesses.

Larsen & Toubro Q1 Results FY2027: Larsen & Toubro reported a steady Q1 FY27 financial performance, with Profit After Tax (PAT) rising 15.51% YoY to ₹4,988.03 crore and revenue from operations increasing 6.69% YoY to ₹67,941.74 crore. The company delivered solid double-digit bottom-line growth during the quarter.
Larsen & Toubro Q1 Results 2027: On 28 July, Larsen & Toubro reported its financial performance for the first quarter of FY27. Revenue from operations increased 6.69% year-on-year to ₹67,941.74 crore, while Profit After Tax (PAT) rose 15.51% YoY to ₹4,988.03 crore.
Larsen & Toubro share price closed up 0.68% at the time of writing. Larsen & Toubro stock is down 7.50% year-to-date and up 11.92% in one year from 28 July 2025 to 28 July 2026.
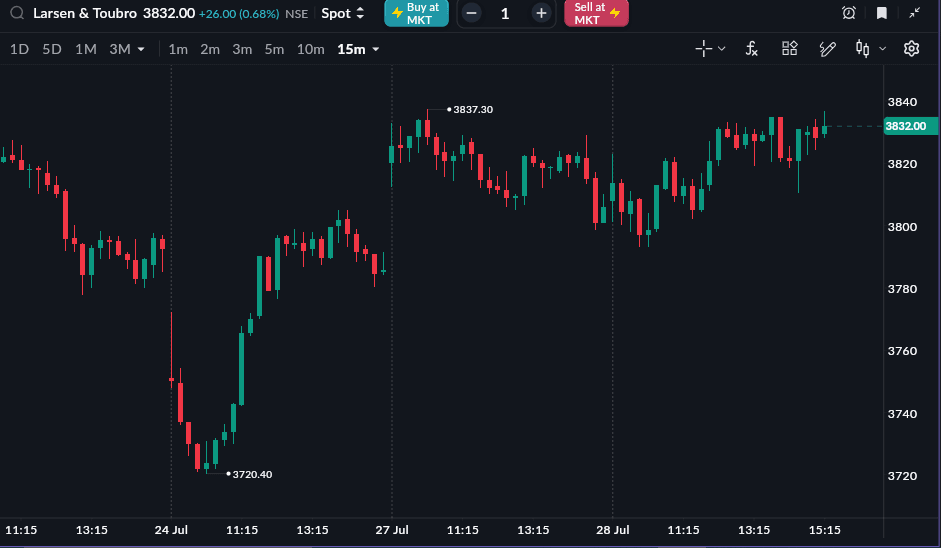
As of 28 July, 3:30 PM
Larsen & Toubro Q1 FY27 Results Highlights
-
Revenue from Operations increased to ₹67,941.74 crore, up 6.69% YoY from ₹63,678.92 crore. Compared with ₹82,762.16 crore in Q4 FY26, revenue decreased 17.91% QoQ.
-
Total Revenue stood at ₹70,318.47 crore in Q1 FY27, registering an 8.12% YoY increase from ₹65,035.70 crore in Q1 FY26. Compared with ₹84,340.75 crore in Q4 FY26, total revenue decreased 16.63% QoQ.
-
EBITDA (Excluding Other Income) stood at ₹6,116.48 crore, registering 3.18% YoY growth from ₹6,317.66 crore. Compared with ₹8,610.26 crore in Q4 FY26, EBITDA decreased 28.96% QoQ.
-
EBITDA Margin stood at 9.00%, compared with 9.92% in Q1 FY26 and 10.40% in Q4 FY26, declining by 0.92 percentage points YoY and by 1.40 percentage points QoQ.
-
Profit After Tax (PAT) stood at ₹4,988.03 crore, rising 15.51% YoY from ₹4,318.17 crore. Compared with ₹6,133.06 crore in Q4 FY26, PAT decreased 18.67% QoQ.
-
PAT Margin stood at 7.34%, compared with 6.78% in Q1 FY26 and 7.41% in Q4 FY26, improving by 0.56 percentage points YoY while declining by 0.07 percentage points QoQ.
|
Metric |
Q1 FY27 |
Q4 FY26 |
QoQ % |
Q1 FY26 |
YoY % |
|---|---|---|---|---|---|
|
Revenue from Operations (₹ Cr) |
67,941.74 |
82,762.16 |
-17.91% |
63,678.92 |
6.69% |
|
Total Revenue (₹ Cr) |
70,318.47 |
84,340.75 |
-16.63% |
65,035.70 |
8.12% |
|
EBITDA (₹ Cr) |
6,116.48 |
8,610.26 |
-28.96% |
6,317.66 |
3.18% |
|
EBITDA Margin |
9.00% |
10.40% |
-1.40% |
9.92% |
-0.92% |
|
PAT (₹ Cr) |
4,988.03 |
6,133.06 |
-18.67% |
4,318.17 |
15.51% |
|
PAT Margin |
7.34% |
7.41% |
-0.07% |
6.78% |
0.56% |
|
EPS (₹) |
29.97 |
38.71 |
-22.58% |
26.30 |
13.95% |
L&T Q1 Segment-wise Revenue
The company's operational revenue was spearheaded by the Infrastructure and Technology verticals, alongside strong growth in Realty and Financial Services. Below is the detailed segment-wise revenue breakup comparing Q1 FY27 performance with Q4 FY26 and Q1 FY26.
|
Segment Revenue |
Q1 FY27 |
Q4 FY26 |
QoQ % |
Q1 FY26 |
YoY % |
|---|---|---|---|---|---|
|
Infra (₹ Cr) |
22,143.53 |
29,221.35 |
-24.22% |
22,696.07 |
-2.43% |
|
Energy - Conventional (₹ Cr) |
14,246.31 |
16,113.52 |
-11.59% |
12,467.57 |
14.27% |
|
Energy - Green (₹ Cr) |
5,607.09 |
11,426.16 |
-50.93% |
6,335.48 |
-11.50% |
|
Manufacturing and Products (₹ Cr) |
4,647.63 |
6,351.74 |
-26.83% |
4,276.17 |
8.69% |
|
Technology, Platform & Services (₹ Cr) |
14,719.94 |
14,273.58 |
3.13% |
12,730.18 |
15.63% |
|
Financial Service (₹ Cr) |
5,041.69 |
4,669.29 |
7.98% |
3,971.01 |
26.96% |
|
Realty (₹ Cr) |
1,133.40 |
521.83 |
117.20% |
534.60 |
112.01% |
|
Development Projects (₹ Cr) |
1,073.69 |
1,175.71 |
-8.68% |
1,249.28 |
-14.06% |
|
Less: Inter Segment Revenue (₹ Cr) |
671.54 |
991.02 |
-32.24% |
581.44 |
15.50% |
|
Total Segment Revenue (₹ Cr) |
67,941.74 |
82,762.16 |
-17.91% |
63,678.92 |
6.69% |
READ THIS ALSO: Netweb Technologies Q1 Results 2027
L&T Order Book Breakdown
L&T maintained strong booking momentum during the quarter, with contributions from the infrastructure and green energy segments. The following table provides a detailed summary of order inflows, comparing the performance for Q1 FY27 against Q1 FY26.
|
Order Inflow Segment |
Q1 FY26 (₹ Cr) |
Q1 FY27 (₹ Cr) |
YoY Growth (%) |
|---|---|---|---|
|
Infrastructure & Utilities |
20,074 |
44,357 |
+120.97% |
|
Energy - Conventional |
31,420 |
3,053 |
-90.28% |
|
Energy - Green |
20,950 |
33,042 |
+57.72% |
|
Manufacturing & Products |
3,190 |
5,535 |
+73.51% |
|
Technology, Platforms & Services |
12,619 |
14,611 |
+15.79% |
|
Financial Services |
3,971 |
5,042 |
+26.97% |
|
Realty |
987 |
1,299 |
+31.61% |
|
Development Projects |
1,242 |
1,074 |
-13.53% |
|
Total Order Inflow |
94,453 |
1,08,014 |
+14.36% |
Source: Larsen & Toubro Q1 FY27 Financial Results.