
Liquidity Sweep Scalping: Spot Stop Hunts on Nifty & Bank Nifty
Liquidity sweeps trap retail traders every day on Nifty and Bank Nifty. This guide breaks down how they work, where they happen, and how to scalp them — with real setups and examples.
Liquidity Sweep Scalping: How Smart Money Traps Retail Traders (And How You Can Trade With Them)
Part of the Scalping Trading Strategies: Complete Guide series.
What's Inside This Guide
- What Is a Liquidity Sweep?
- Why Liquidity Sweeps Happen (The Mechanics)
- Where Liquidity Pools Form on Nifty & Bank Nifty Charts
- Liquidity Sweep vs. Real Breakout: How to Tell the Difference
- Liquidity Sweep vs. Liquidity Grab
- The Liquidity Sweep Scalping Strategy: Step by Step
- Worked Example: Liquidity Sweep on Nifty (1-Minute Chart)
- Liquidity Sweeps on Expiry Day: Why Tuesdays Are Hunting Season
- Confirmation Tools: Volume, OI, and What to Watch on Sahi
- Risk Management for Sweep Trades
- Common Mistakes (And How to Avoid Them)
- How to Practise Without Risking Capital
- FAQs
What Is a Liquidity Sweep?
You've seen it happen. Nifty forms a clean support at 24,200. It bounces off that level three times. Every textbook says "buy at support." So you go long at 24,210 with a stop-loss at 24,180.
Then this happens: price dips to 24,170 — taking out your stop — and within two minutes, it's at 24,280. The move you predicted happened. But you weren't in it. Your stop was the fuel.
That wasn't bad luck. That was a liquidity sweep.
A liquidity sweep is when price breaks beyond an obvious level — a well-watched high or low — to trigger the cluster of stop-loss orders sitting just beyond it. Once those orders are filled, the market reverses in the opposite direction. What looked like a breakout was, in reality, the market collecting the orders it needed to move the other way.
This isn't conspiracy. It's mechanics. Large participants — institutional traders, market makers, algorithmic systems — need opposing orders to fill their large positions without excessive slippage. Your stop-loss is a market order in disguise. When it gets triggered, it provides exactly the liquidity they need. A cluster of sell stops below support gives a large buyer the sell orders they need to fill a massive buy position. A cluster of buy stops above resistance gives a large seller the buy orders they need to exit.
Understanding this changes how you read every chart.
Why Liquidity Sweeps Happen (The Mechanics)
To understand sweeps, you need to understand a fundamental asymmetry in the market: retail traders and institutional traders face completely different execution problems.
When you buy 1 lot of Nifty options, you click "Buy" and get filled instantly. The market barely notices your order.
When an institution needs to deploy ₹50 crore into a position, they can't just click "Buy." If they place a massive market order, the price will move against them before the order is fully filled — this is called market impact. So instead, they need to find enough opposing orders (liquidity) at a favourable price. And the most reliable source of opposing orders? Stop-losses.
Here's the sequence:
- A visible level forms. Price bounces off 24,200 multiple times. Every retail trader sees it. It becomes a "known" support.
- Stops cluster below the level. Traders who go long at 24,200 place their stop-losses at 24,180, 24,170, 24,160 — just below support. This is what they've been taught: "Place your stop just below support." The result: a dense cluster of sell orders sitting a few points below a level that the entire market is watching.
- Price is pushed through the level. Aggressive selling (or simply the natural flow of a pullback) pushes price below 24,200 and into the stop-loss zone. This triggers a cascade of sell orders from stopped-out longs.
- The stops provide liquidity. Those triggered sell orders are immediately absorbed by the large buyer who was waiting. They get their fill at a discounted price — below where they wanted to buy.
- Price reverses. With the large order filled and the selling pressure from stops exhausted, price reverses sharply upward. The "support break" was never a real break — it was a sweep.
The same logic applies in reverse above resistance. Buy stops from short sellers sit above obvious highs. A sweep above the high triggers those stops, provides liquidity for a large seller, and price reverses downward.
Where Liquidity Pools Form on Nifty & Bank Nifty Charts?
Liquidity sweeps don't happen at random price levels. They happen where stops and pending orders accumulate — and those accumulation points are remarkably predictable. Here's where to look on Indian index charts:
1. Previous Day's High and Low (PDH / PDL)
The single most watched reference levels for intraday traders. Almost every scalper and intraday system marks these levels. Stop-losses from traders who went long near PDL sit below it. Stops from traders who shorted near PDH sit above it. Sweeps of PDH/PDL are common in the first 30 minutes of trading when overnight order flow interacts with these levels.
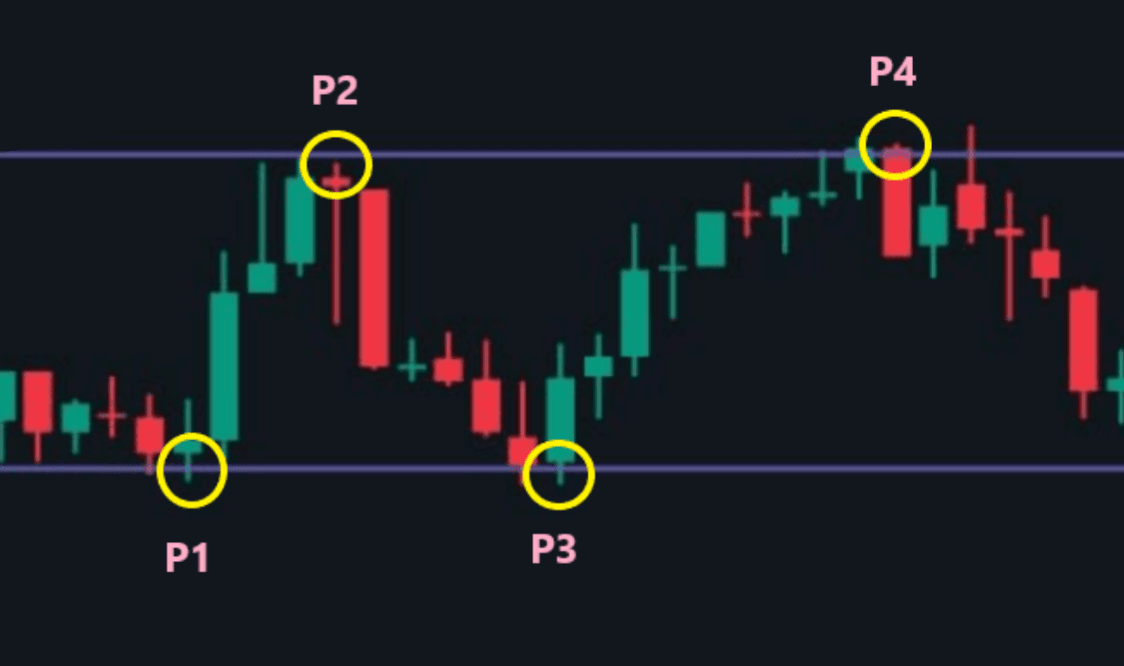
2. Equal Highs and Equal Lows
When price creates two or more highs at nearly the same level (e.g., Nifty touches 24,450 three times and gets rejected each time), it creates a "clean" resistance. The cleaner and more obvious the level, the more stops accumulate above it. Equal lows work the same way — multiple bounces off the same support become a magnet for sell stops just below. These are the highest-probability sweep zones.
3. Round Numbers
24,000. 24,500. 25,000. 50,000 on Bank Nifty. Round numbers attract disproportionate order flow — both limit entries and stop-losses. A sweep through a round number is common, especially during the first hour.
4. Opening Range High / Low (ORH / ORL)
The Opening Range Breakout (ORB) is one of the most popular intraday strategies. Thousands of traders set buy stops above the ORH and sell stops below the ORL. This makes the opening range boundaries prime targets for liquidity sweeps, a fake breakout of the ORH that reverses is a textbook sweep. On Sahi, ORB levels are auto-plotted on the chart, making it easy to spot when price is approaching a potential sweep zone.
5. Session Highs and Lows
The current session's high and low act as intraday liquidity magnets. As the day progresses, traders set stops just beyond these levels. A sweep of the session high or low in the final 90 minutes is a high-probability setup, especially on expiry days.
6. Max Pain and High-OI Strikes
On expiry day, the option chain itself reveals where liquidity sits. Strikes with the highest open interest become gravitational centres. Price sweeping through a high-OI strike — triggering stops from option sellers hedging at that level — before reverting to max pain is a pattern unique to Indian index derivatives.
You can use auto-plotted ORB levels to mark the opening range boundaries. Combine with the live Option Chain inside Scalper Mode to see exactly where OI is concentrated. Those high-OI strikes are your liquidity pool map for expiry days, seamlessly on Sahi.
Liquidity Sweep vs. Real Breakout: How to Tell the Difference
This is the critical skill. Both sweeps and breakouts start the same way — price moves through a key level. The difference shows up in what happens next.
| Signal | Liquidity Sweep (Fake Breakout) | Real Breakout |
|---|---|---|
| Price behaviour after the break | Price pierces the level, pauses briefly, then reverses back inside the range | Price breaks the level, holds beyond it, and starts building structure (higher lows above broken resistance, or lower highs below broken support) |
| Candle close | Closes back inside the prior range — long wick beyond the level | Closes firmly beyond the level — body beyond the line, not just the wick |
| Volume pattern | Volume spikes on the break, then immediately drops on the reversal | Volume expands on the break and sustains — follow-through volume on the next 2–3 candles |
| VWAP positioning | Price breaks the level but VWAP stays inside the range (no institutional commitment) | VWAP shifts with the breakout direction — confirming that volume-weighted activity supports the move |
| OI change (on option chain) | No significant OI buildup at the new level — institutions aren't adding positions | Fresh OI buildup at or near the breakout level — suggests new positions being opened |
| Time of day | More common in the first 15 minutes (stop hunting before direction is set) and in the final hour | More common after 9:45 AM once direction is established, especially with global cue alignment |
The Golden Rule: Watch the close, not the wick. A wick beyond the level is noise. A candle close beyond the level with sustained volume is signal. If the candle closes back inside, you're looking at a sweep — and that's your entry signal for a trade in the opposite direction.
Liquidity Sweeps on Expiry Days
Nifty weekly options expire every Tuesday. On expiry day, liquidity sweep behaviour intensifies because of two forces converging:
1. Theta acceleration creates urgency. ATM options that started the day at ₹80–₹100 will decay to near-zero by 3:00 PM if the market stays flat. This compresses the tradeable window and forces participants to act — which means stop-losses are tighter and more clustered.
2. Max pain acts as a gravitational centre. Max pain is the strike price at which option buyers experience the highest aggregate loss. On expiry day, price often converges toward max pain — and the path to get there frequently involves sweeping through both the high and the low of the day's range, taking out stops on both sides.
A common expiry day pattern:
- Nifty opens and establishes a range in the first 30 minutes.
- Mid-morning, price sweeps below the range low — triggering longs' stops and call buyers' exits.
- Price reverses sharply.
- Afternoon, price sweeps above the range high — triggering shorts' stops and put buyers' exits.
- Price reverses again and settles near max pain.
This two-sided sweep is the market collecting liquidity on both ends before settling. If you're aware of this pattern, you stop getting swept — and start trading the sweeps themselves.
On Sahi, check the live Option Chain inside Scalper Mode to identify the max pain zone and the strikes with highest OI. Combine with OI Change data refreshing in real time — when you see a sudden OI unwind at a key strike during a sweep, it confirms that stops and positions are being cleared. This is your green light.
Risk Management for Sweep Trades
Sweep trades have a natural advantage: the stop-loss is tight (just beyond the sweep extreme), which means your risk per trade is small relative to the potential reward. But you still need rules.
Stop-loss: 2–5 points beyond the sweep wick extreme. No exceptions. If price goes back beyond the sweep, the thesis is invalidated. Exit immediately. Also risk around 0.5–1% of capital per trade.
Daily limit: Maximum 3 sweep trades per day. Sweeps are high-conviction setups that don't appear every 10 minutes. If you're seeing "sweeps everywhere," you're forcing the pattern. Quality over quantity.
Partial profit: Take 50% off at the first target (midpoint of range or VWAP). Trail the remaining 50% with a stop at breakeven. This locks in profit and gives the trade room to reach the opposing liquidity pool.
Don't average down: If a sweep trade goes against you and your stop hits, it means the "sweep" was actually a real breakout. Accept the loss. Don't add size hoping for a reversal that may never come.
Use Auto SL/TP in Scalper 2.0 to pre-set your stop and target before you enter. The moment you execute, your exit orders are live — no fumbling with the order panel while the market moves. Set your SL as a limit order for tighter fills, and choose between Best Bid/Offer, LTP, or Midpoint pricing.
Common Mistakes (And How to Avoid Them)
1. Entering during the sweep, not after.
The most common error. You see price break below support and think "it's going lower, let me short!" You enter during the sweep and get caught in the reversal. Always wait for the candle to close back inside the range, or for a confirmation candle, before entering.
2. Trading sweeps against the higher-timeframe trend.
A sweep of a high during a strong uptrend on the 15-minute chart is less likely to produce a sustained reversal. The trend usually wins. Trade sweeps in the direction of your 15-minute bias. If the trend is up, buy sweeps of lows. If the trend is down, sell sweeps of highs.
3. Treating every wick as a sweep.
Not every long wick is a liquidity sweep. A sweep specifically targets a well-defined level where stops are known to cluster. A random wick in the middle of a range is just noise. The level must be obvious — something any trader looking at the chart would identify as support or resistance.
4. Ignoring volume confirmation.
A sweep without a volume spike is just price fluctuation. The volume spike confirms that stops were actually triggered. Without it, you're guessing.
5. Using indicators as the primary signal.
RSI, MACD, and Bollinger Bands are lagging by design — they describe what has already happened. Liquidity sweeps are price action events that happen in real time. Use indicators for confirmation, not as the trigger. The trigger is the sweep-and-rejection price action itself.
6. Trading sweeps in low-liquidity windows.
Between 10:30 AM and 2:00 PM IST, Nifty often enters a low-volume drift. Sweeps during this window are lower in conviction because the volume behind them is thin. The best sweep setups occur between 9:15–10:15 AM and 2:30–3:30 PM when participation is highest.
Disclaimer: The content provided is for educational purposes only and does not constitute financial advice. Trading in securities involves significant risk, including the risk of loss. Past performance does not guarantee future results. SEBI data shows that 91% of individual traders in the F&O segment incurred net losses in FY25. Always conduct your own research and consider consulting a SEBI-registered investment adviser before making trading decisions. Sahi is a SEBI-registered stockbroker. For full details, refer to the disclaimer.