
LIC Q1 Results 2027: Net Premium Income Rises 7% YoY, PAT Increases 24% to ₹13,584 Cr
LIC reported steady Q1 FY27 growth with higher premium income, a 24% rise in net profit, improved solvency ratio, and lower gross NPAs.

LIC Q1 Results FY2027: LIC reported a steady performance in the first quarter of FY27, supported by growth in net premium income and strong improvement in profitability. The insurer witnessed healthy year-on-year growth in earnings, while its solvency ratio strengthened during the quarter, reflecting continued financial stability.
LIC Q1 Results FY2027: On 6 August 2026, Life Insurance Corporation of India announced its financial results for the first quarter ended 30 June 2026. Net Premium Income increased 6.69% YoY to ₹1,27,623 crore compared with ₹1,19,618 crore in Q1 FY26.
While Profit After Tax (PAT) increased 23.98% YoY to ₹13,584 crore compared with ₹10,957 crore in Q1 FY26.
Total Income stood at ₹2,38,558 crore during Q1 FY27, registering a growth of 6.68% compared with ₹2,23,605 crore in Q1 FY26. The company's solvency ratio improved to 2.42 from 2.17 in the year-ago period.
LIC share price closed 1.39% lower on 6 August 2026. The stock has delivered -9% returns year-to-date and -13% returns over the one-year period from 6 August 2025 to 6 August 2026.
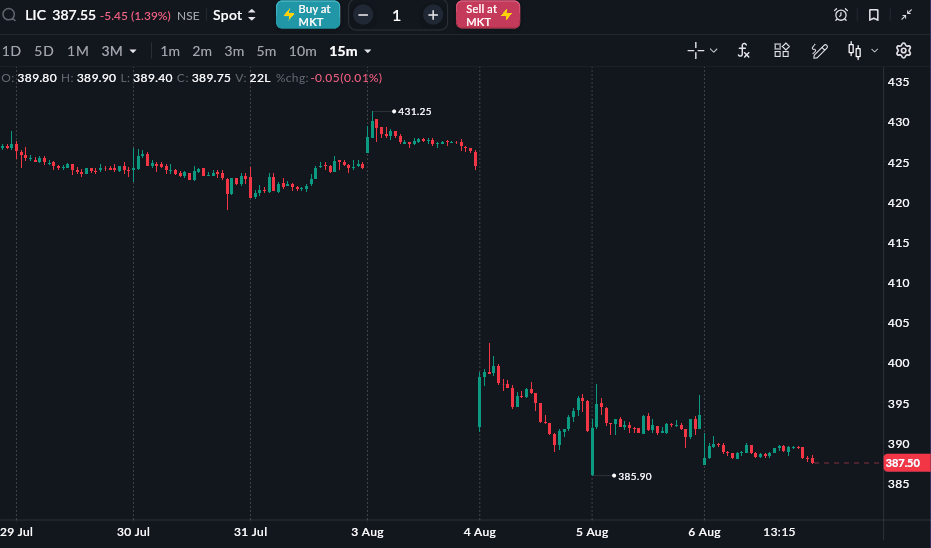
As of 6 Aug, 3:30 PM
READ THIS: Crompton Greaves Q1 Results FY2027
LIC Q1 FY27 Results Highlights (Consolidated)
-
Net Premium Income stood at ₹1,27,623 crore, registering a 6.69% YoY increase from ₹1,19,618 crore in Q1 FY26. Compared with ₹1,65,067 crore in Q4 FY26, net premium income declined 22.69% QoQ.
-
Total Income stood at ₹2,38,558 crore, registering a 6.68% YoY increase from ₹2,23,605 crore in Q1 FY26. Compared with ₹2,77,394 crore in Q4 FY26, total income declined 13.99% QoQ.
-
Profit After Tax (PAT) stood at ₹13,584 crore, compared with ₹10,957 crore in Q1 FY26, registering a 23.98% YoY increase. Compared with ₹23,467 crore in Q4 FY26, PAT declined 42.11% QoQ.
-
PAT Margin stood at 5.69% during Q1 FY27 compared with 4.90% in Q1 FY26, improving by 0.79 percentage points YoY.
-
Solvency Ratio stood at 2.42 as of Q1 FY27, compared with 2.17 in Q1 FY26 and 2.35 in Q4 FY26, improving by 0.25 points YoY.
-
Assets Under Management (AUM) stood at ₹59,39,384 crore, compared with ₹57,05,341 crore in Q1 FY26, registering a growth of 4.12% YoY.
-
Gross Non-Performing Assets (NPAs) stood at ₹7,168 crore, declining 15.04% YoY from ₹8,436 crore in Q1 FY26.
-
Net NPAs stood at ₹4.92 crore, compared with ₹3.63 crore in Q1 FY26, increasing 35.54% YoY.
|
Metric |
Q1 FY27 |
Q4 FY26 |
QoQ % |
Q1 FY26 |
YoY % |
|---|---|---|---|---|---|
|
Net Premium Income (₹ Cr) |
1,27,623 |
1,65,067 |
-22.69% |
1,19,618 |
6.69% |
|
Total Income (₹ Cr) |
2,38,558 |
2,77,394 |
-13.99% |
2,23,605 |
6.68% |
|
PAT (₹ Cr) |
13,584 |
23,467 |
-42.11% |
10,957 |
23.98% |
|
PAT Margin |
5.69% |
8.46% |
-2.77 ppt |
4.90% |
+0.79 ppt |
|
Solvency Ratio |
2.42 |
2.35 |
+0.07 |
2.17 |
+0.25 |
|
Gross NPAs (₹ Cr) |
7,168 |
7,205 |
-0.52% |
8,436 |
-15.04% |
|
Net NPAs (₹ Cr) |
4.92 |
4.34 |
13.36% |
3.63 |
35.54% |
|
AUM (₹ Cr) |
59,39,384 |
— |
— |
57,05,341 |
4.12% |
|
EPS (₹) |
10.74 |
18.55 |
-42.10% |
8.66 |
24.02% |
Source: Company Filing
All topics
Click the link, confirm the box next to sahi.com is checked — ignore any other results.