
Kalyan Jewellers Q1 Results 2027: Revenue Rises 46% YoY, PAT Increases 32% to ₹349 Cr
Kalyan Jewellers reported strong Q1 FY27 revenue growth driven by healthy jewellery demand, while net profit rose 32% despite moderation in operating margins.

Kalyan Jewellers Q1 Results FY2027: Kalyan Jewellers reported strong revenue growth in Q1 FY27, driven by robust demand for gold and jewellery. Despite healthy sales growth, profitability margins moderated due to higher operating costs, while PAT increased 32% YoY during the quarter.
Kalyan Jewellers Q1 Results FY2027: On 4 August 2026, Kalyan Jewellers India announced its financial results for the first quarter ended 30 June 2026. Revenue from Operations increased 45.68% YoY to ₹10,589 crore compared with ₹7,268 crore in Q1 FY26,
While Profit After Tax (PAT) increased 32.03% YoY to ₹349 crore compared with ₹264 crore in Q1 FY26. EBITDA Margin stood at 5.97% during the quarter.
Kalyan Jewellers share price closed at -2.73% on 4 August 2026. The stock has delivered 22% returns year-to-date and -1% returns over the one year from 4 August 2025 to 4 August 2026.
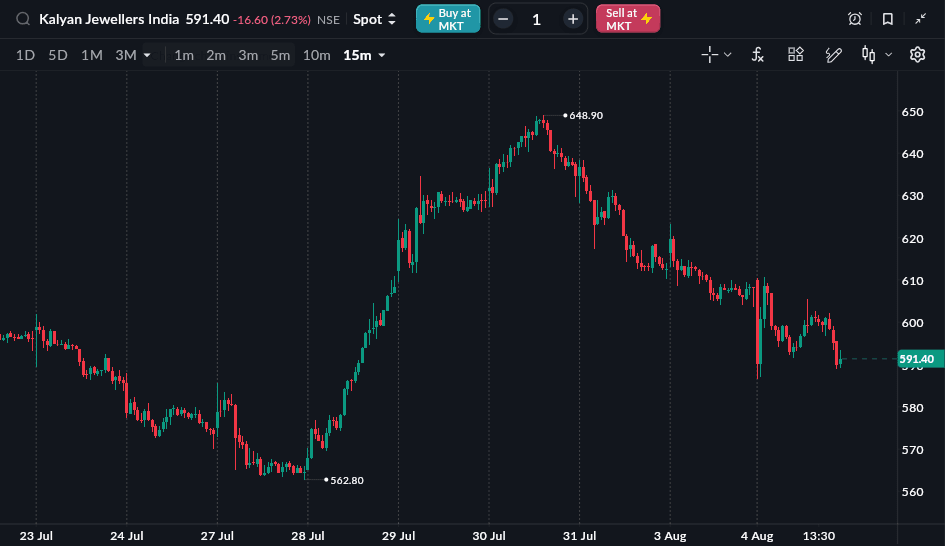
As of 4 Aug, 3:30 PM
Kalyan Jewellers Q1 FY27 Results Highlights
-
Revenue from Operations stood at ₹10,589 crore, registering a 45.68% YoY increase from ₹7,268 crore in Q1 FY26. Compared with ₹10,275 crore in Q4 FY26, revenue increased 3.06% QoQ.
-
Total Revenue stood at ₹10,645 crore, registering a 45.52% YoY increase from ₹7,315 crore in Q1 FY26. Compared with ₹10,321 crore in Q4 FY26, total revenue increased 3.13% QoQ.
-
EBITDA (Excluding Other Income) stood at ₹633 crore, compared with ₹523 crore in Q1 FY26, registering a 20.94% YoY increase. Compared with ₹736 crore in Q4 FY26, EBITDA declined 14.02% QoQ.
-
EBITDA Margin stood at 5.97%, compared with 7.20% in Q1 FY26 and 7.16% in Q4 FY26, declining by 1.22 percentage points YoY and 1.19 percentage points QoQ.
-
Profit After Tax (PAT) stood at ₹349 crore, compared with ₹264 crore in Q1 FY26, registering a 32.03% YoY increase. Compared with ₹410 crore in Q4 FY26, PAT declined 14.86% QoQ.
-
PAT Margin stood at 3.29%, compared with 3.63% in Q1 FY26 and 3.99% in Q4 FY26, declining by 0.34 percentage points YoY and 0.69 percentage points QoQ.
-
EPS stood at ₹3.38, compared with ₹2.56 in Q1 FY26 and ₹3.97 in Q4 FY26, increasing 32.03% YoY and declining 14.86% QoQ.
|
Metric |
Q1 FY27 |
Q4 FY26 |
QoQ % |
Q1 FY26 |
YoY % |
|---|---|---|---|---|---|
|
Revenue from Operations (₹ Cr) |
10,589 |
10,275 |
3.06% |
7,268 |
45.68% |
|
Total Revenue (₹ Cr) |
10,645 |
10,321 |
3.13% |
7,315 |
45.52% |
|
EBITDA (Excl. Other Income) (₹ Cr) |
633 |
736 |
-14.02% |
523 |
20.94% |
|
EBITDA Margin |
5.97% |
7.16% |
-1.19 ppt |
7.20% |
-1.22 ppt |
|
PAT (₹ Cr) |
349 |
410 |
-14.86% |
264 |
32.03% |
|
PAT Margin |
3.29% |
3.99% |
-0.69 ppt |
3.63% |
-0.34 ppt |
|
EPS (₹) |
3.38 |
3.97 |
-14.86% |
2.56 |
32.03% |
Source: Company Filing
All topics
Click the link, confirm the box next to sahi.com is checked — ignore any other results.