
ITC Hotels Q1 FY27 Results: PAT Rises 36%, Revenue Up 15% YoY
ITC Hotels reported healthy year-on-year growth in revenue and profit during Q1 FY27, although earnings declined from the previous quarter.

ITC Hotels Q1 Results 2027: ITC Hotels reported a healthy Q1 FY27 performance, with revenue from operations rising 14.77% YoY to ₹936.02 crore and PAT increasing 36.05% to ₹181.91 crore. EBITDA also grew 19.48%, while margins improved compared with the year-ago quarter.
ITC Hotels Q1 Results 2027: On 16 July, ITC Hotels reported a mixed performance for the first quarter of FY27. While the company delivered healthy year-on-year growth in revenue and profitability, PAT declined 42% from the previous quarter. Here is a detailed breakdown of ITC Hotels' Q1 FY27 results.
ITC Hotels Q1 Results 2027 Highlights
-
ITC Hotels reported revenue from operations of ₹936.02 crore in Q1 FY27, registering 14.77% YoY growth from ₹815.54 crore in the same quarter last year. On a quarterly basis, revenue from operations declined 25.34% from Q4 FY26.
-
Total revenue stood at ₹994.54 crore, up 15.68% YoY from ₹859.72 crore. Compared with the March quarter, total revenue declined 23.87%.
-
EBITDA (excluding other income) came in at ₹292.32 crore, compared with ₹244.67 crore in the year-ago quarter, reflecting 19.48% YoY growth. EBITDA declined 37.31% from ₹466.30 crore reported in Q4 FY26.
-
Profit After Tax (PAT) stood at ₹181.91 crore, up 36.05% YoY from ₹133.71 crore in Q1 FY26. Sequentially, PAT declined 42.69% from ₹317.43 crore reported in Q4 FY26.
-
PAT margin expanded to 19.43%, compared with 16.40% in Q1 FY26, reflecting an improvement of 304 basis points YoY. However, the margin contracted 589 basis points from 25.32% in Q4 FY26.
-
Basic Earnings Per Share (EPS) rose to ₹0.87, compared with ₹0.64 in the corresponding quarter last year, reflecting 35.94% YoY growth. Sequentially, EPS declined 42.76% from ₹1.52 reported in Q4 FY26.
|
Metric |
Q1 FY27 |
Q4 FY26 |
QoQ Change |
Q1 FY26 |
YoY Change |
|---|---|---|---|---|---|
|
Revenue from Operations (₹ Cr) |
936.02 |
1,253.70 |
-25.34% |
815.54 |
14.77% |
|
Total Revenue (₹ Cr) |
994.54 |
1,306.45 |
-23.87% |
859.72 |
15.68% |
|
EBITDA (₹ Cr) |
292.32 |
466.30 |
-37.31% |
244.67 |
19.48% |
|
EBITDA Margin (%) |
31.23% |
37.19% |
-596 bps |
30.00% |
+123 bps |
|
Profit After Tax (₹ Cr) |
181.91 |
317.43 |
-42.69% |
133.71 |
36.05% |
|
PAT Margin (%) |
19.43% |
25.32% |
-589 bps |
16.40% |
+304 bps |
|
Basic EPS (₹) |
0.87 |
1.52 |
-42.76% |
0.64 |
35.94% |
Source: Q1 RESULTS
ITC Q1 Segment-wise Revenue
The Hotels business remained the company's largest revenue contributor during Q1 FY27, despite reporting a year-on-year decline. Revenue from Branded Residences also fell sharply, while the Others segment posted double-digit growth compared with the previous quarter.
|
Segment |
Q1 FY27 (₹ Cr) |
Q4 FY26 (₹ Cr) |
QoQ Change |
Q1 FY26 (₹ Cr) |
YoY Change |
|---|---|---|---|---|---|
|
Hotels |
881.06 |
800.57 |
10.05% |
1,103.95 |
-20.19% |
|
Branded Residences |
37.77 |
– |
- |
129.38 |
-70.81% |
|
Others |
11.73 |
10.06 |
16.60% |
13.28 |
-11.67% |
|
Total |
930.56 |
810.63 |
14.79% |
1,246.61 |
-25.35% |
ITC Hotels Share Price Today
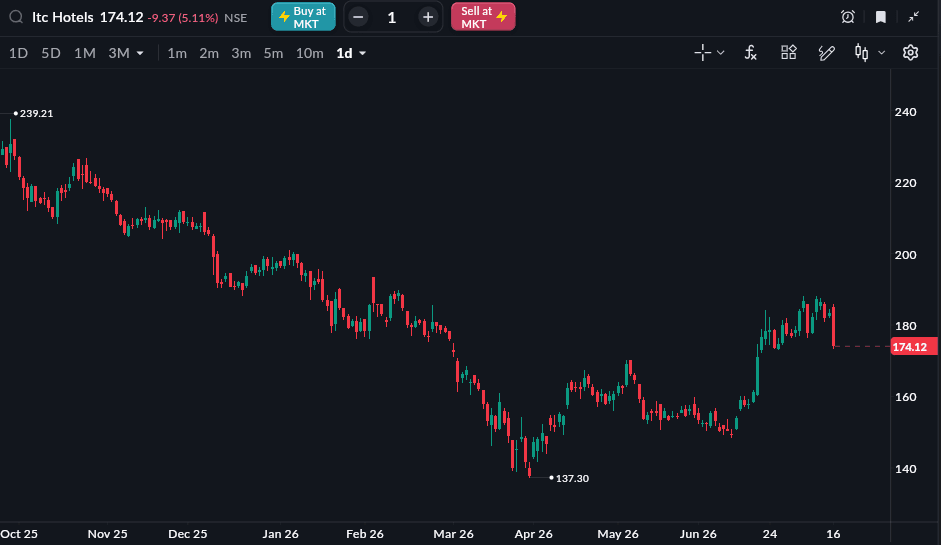
Data as of 16th July 2026 3:00 PM
After its Q1 FY27 earnings announcement, ITC Hotels shares were trading at ₹174.75 on NSE, down 4.77% during Thursday's ongoing trading session.
All topics
Click the link, confirm the box next to sahi.com is checked — ignore any other results.