
India Cements Q1 FY27: Profit Turns Positive, Margin Expands
India Cements returned to profit in Q1 FY27 as EBITDA nearly doubled and margins improved, although revenue remained largely flat and quarterly profit moderated.

India Cements Q1 2027 Results: India Cements reported a turnaround in Q1 FY27, posting a PAT of ₹26.85 crore against a loss a year ago. EBITDA surged 87% YoY with margin expanding to 15.28%, while revenue remained broadly flat. However, sequential profitability moderated due to lower revenue and exceptional gains.
India Cements Q1 Results FY2027: On 18 July, India Cements reported an improvement in operating performance for the first quarter of FY27. While revenue from operations remained broadly flat year-on-year at ₹1,019.42 crore, the company reported a sharp improvement in profitability, with EBITDA surging 87.19% YoY to ₹155.72 crore.
The company also returned to profitability, reporting a PAT of ₹26.85 crore against a loss in the same quarter last year. Here's a detailed breakdown of India Cements' Q1 FY27 results.
India Cements Q1 FY2027 Results Highlights
-
Revenue from Operations stood at ₹1,019.42 crore in Q1 FY27, declining 0.52% YoY from ₹1,024.74 crore. Compared with ₹1,228.65 crore in Q4 FY26, revenue declined 17.03% QoQ.
-
Total Income stood at ₹1,022.87 crore, down 1.06% YoY from ₹1,033.85 crore. On a quarterly basis, total income declined 18.46% from ₹1,254.50 crore.
-
EBITDA (excluding Other Income) increased to ₹155.72 crore, registering 87.19% YoY growth from ₹83.19 crore. Compared with ₹153.10 crore in Q4 FY26, EBITDA increased 1.71% QoQ. EBITDA Margin improved to 15.28%, compared with 8.12% in Q1 FY26 and 12.46% in Q4 FY26.
-
Profit After Tax (PAT) stood at ₹26.85 crore, compared with a loss of ₹131.37 crore in Q1 FY26. Sequentially, PAT declined 54.87% from ₹59.50 crore reported in Q4 FY26.
-
PAT Margin improved to 2.63%, compared with -12.82% in Q1 FY26, reflecting an expansion of 1,545 basis points YoY. Compared with 4.84% in Q4 FY26, PAT margin contracted 221 basis points.
-
Earnings Per Share (EPS) stood at ₹0.87, compared with a loss per share of ₹4.29 in Q1 FY26, reflecting the company's return to profitability. Compared with ₹1.92 in Q4 FY26, EPS declined 54.69% QoQ.
|
Metric |
Q1 FY27 |
Q4 FY26 |
QoQ % |
Q1 FY26 |
YoY % |
|---|---|---|---|---|---|
|
Revenue from Operations (₹ Cr) |
1,019.42 |
1,228.65 |
-17.03% |
1,024.74 |
-0.52% |
|
Total Income (₹ Cr) |
1,022.87 |
1,254.50 |
-18.46% |
1,033.85 |
-1.06% |
|
EBITDA (₹ Cr) |
155.72 |
153.10 |
1.71% |
83.19 |
87.19% |
|
EBITDA Margin |
15.28% |
12.46% |
+282 bps |
8.12% |
+716 bps |
|
Profit After Tax (₹ Cr) |
26.85 |
59.50 |
-54.87% |
-131.37 |
Turnaround |
|
PAT Margin |
2.63% |
4.84% |
-221 bps |
-12.82% |
+1,545 bps |
|
EPS (₹) |
0.87 |
1.92 |
-54.69% |
-4.29 |
Turnaround |
Source: India Cements Q1 FY27 Consolidated Financial Results.
India Cements Share Price Today
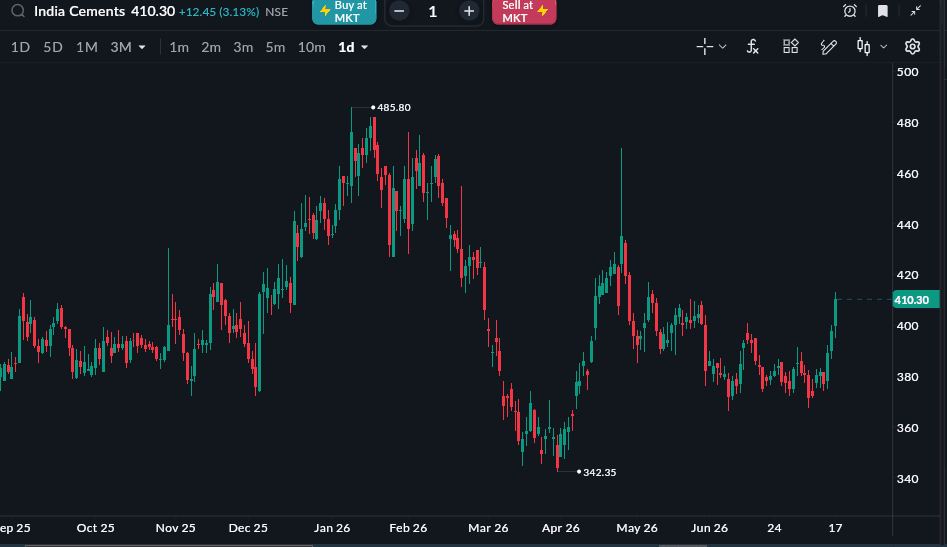
As of 17 July, 3.30 PM
Indiastock closed at 410.30 and 3.13% higher on 17 July 2026 . The stock is still down -5.74% year-to-date and up 17.18% over the last year.
.
All topics
Click the link, confirm the box next to sahi.com is checked — ignore any other results.