
Hyundai Motor Q1 Results 2027: PAT Declines 35% YoY, Revenue Remains Flat
Hyundai Motor India reported a subdued Q1 FY27 performance as profit declined sharply and operating margins contracted, while revenue remained largely unchanged from the year-ago quarter.

Hyundai Motor India Q1 Results 2027: Hyundai Motor India reported a subdued performance for Q1 FY27, with Profit After Tax (PAT) declining to ₹888.62 crore while Revenue from Operations remained largely flat at ₹16,334.63 crore. The company witnessed pressure on profitability, with EBITDA margins contracting during the quarter.
Hyundai Motor India Q1 Results FY2027: On 30 July 2026, Hyundai Motor India announced its financial results for the first quarter ended June 30, 2026. Revenue from Operations declined 0.48% YoY to ₹16,334.63 crore, while Profit After Tax (PAT) fell 35.10% YoY to ₹888.62 crore.
Ahead of the Hyundai Q1 results, Hyundai Motors share price closed 1.27% higher. However, on a year-to-date (YTD) basis, Hyundai Motor share price is down 12%. Over the past one year (30 July 2025 to 30 July 2026), the stock has declined 2%.
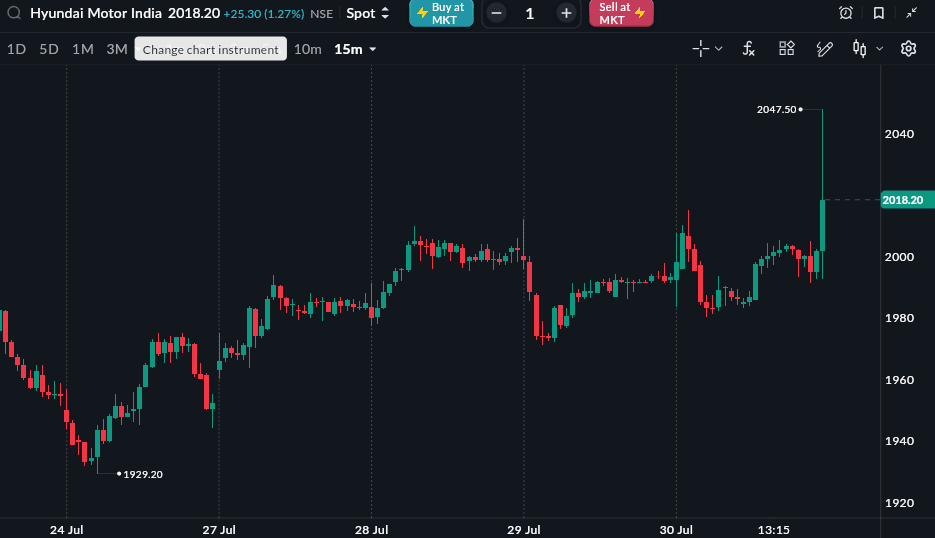
As of 30 July 2026, 3:30 PM
Hyundai Motor India Q1 FY27 Results Highlights
-
Revenue from Operations stood at ₹16,334.63 crore, down 0.48% YoY from ₹16,412.87 crore. Compared with ₹18,916.15 crore in Q4 FY26, revenue declined 13.65% QoQ.
-
Total Revenue stood at ₹16,608.99 crore, registering a 0.11% YoY decline from ₹16,627.66 crore in Q1 FY26. Compared with ₹19,175.53 crore in Q4 FY26, total revenue declined 13.38% QoQ.
-
EBITDA (Excluding Other Income) stood at ₹1,511.70 crore, registering a 30.82% YoY decline from ₹2,185.22 crore. Compared with ₹1,965.97 crore in Q4 FY26, EBITDA declined 23.11% QoQ.
-
EBITDA Margin stood at 9.25%, compared with 13.31% in Q1 FY26 and 10.39% in Q4 FY26, declining by 406 bps YoY and 114 bps QoQ.
-
Profit After Tax (PAT) stood at ₹888.62 crore, compared with ₹1,369.23 crore in Q1 FY26, registering a 35.10% YoY decline. Compared with ₹1,255.64 crore in Q4 FY26, PAT declined 29.23% QoQ.
-
PAT Margin stood at 5.44%, compared with 8.34% in Q1 FY26 and 6.64% in Q4 FY26, declining by 290 bps YoY and 120 bps QoQ.
-
EPS stood at ₹10.94, compared with ₹16.85 in Q1 FY26, declining by ₹5.91 YoY. Compared with ₹15.45 in Q4 FY26, EPS declined by ₹4.51 QoQ.
|
Metric |
Q1 FY27 |
Q4 FY26 |
QoQ % |
Q1 FY26 |
YoY % |
|---|---|---|---|---|---|
|
Revenue from Operations (₹ Cr) |
16,334.63 |
18,916.15 |
-13.65% |
16,412.87 |
-0.48% |
|
Total Income (₹ Cr) |
16,608.99 |
19,175.53 |
-13.38% |
16,627.66 |
-0.11% |
|
EBITDA (₹ Cr) |
1,511.70 |
1,965.97 |
-23.11% |
2,185.22 |
-30.82% |
|
EBITDA Margin |
9.25% |
10.39% |
-114 bps |
13.31% |
-406 bps |
|
PAT (₹ Cr) |
888.62 |
1,255.64 |
-29.23% |
1,369.23 |
-35.10% |
|
PAT Margin |
5.44% |
6.64% |
-120 bps |
8.34% |
-290 bps |
|
EPS (₹) |
10.94 |
15.45 |
-29.19% |
16.85 |
-35.07% |
Source: Hyundai Motor India Q1 FY27 Financial Results.