
Gillette India Q1 Results 2027: PAT Rises 9% YoY, Revenue Up 11%
Gillette India reported steady Q1 FY27 growth, with revenue and profit rising over 10% YoY, while margins and earnings moderated compared with the previous quarter.

Gillette India Q1 Results FY2027: Gillette India reported a steady performance for Q1 FY27, with Profit After Tax (PAT) increasing to ₹159.45 crore and Revenue from Operations rising to ₹783.02 crore. While the company delivered double-digit revenue growth on a year-on-year basis, profitability moderated sequentially due to lower operating margins..
Gillette India Q1 Results FY2027: On 30 July 2026, Gillette India announced its financial results for the first quarter ended June 30, 2026. Revenue from Operations increased 10.80% YoY to ₹783.02 crore, while Profit After Tax (PAT) rose 9.44% YoY to ₹159.45 crore.
Just after the results, Gillette India share price is down 1.41% at the time of writing. Gillette India stock is down 4.01% year-to-date and down 26.47% in one year from 30 July 2025 to 30 July 2026
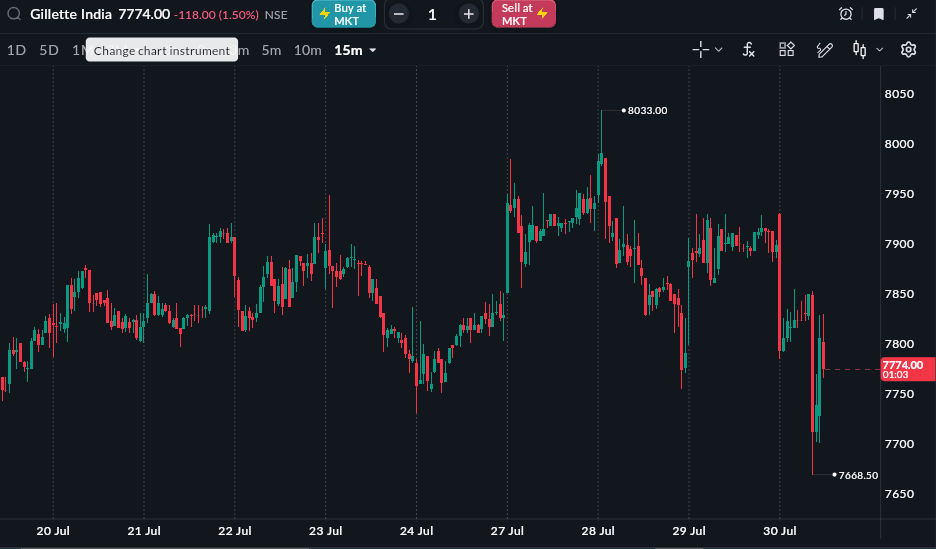
As of 30 July, 12:20 PM
READ THIS ALSO: Indo-MIM Share Lists at 44% Premium on NSE
Gillette India Q1 FY27 Results Highlights
-
Revenue from Operations stood at ₹783.02 crore, up 10.80% YoY from ₹706.72 crore. Compared with ₹792.00 crore in Q4 FY26, revenue declined 1.13% QoQ.
-
Total Revenue stood at ₹788.24 crore, registering a 10.49% YoY increase from ₹713.40 crore in Q1 FY26. Compared with ₹796.98 crore in Q4 FY26, total revenue declined 1.10% QoQ.
-
EBITDA stood at ₹227.79 crore, registering an 8.34% YoY increase from ₹210.25 crore. Compared with ₹277.27 crore in Q4 FY26, EBITDA declined 17.85% QoQ.
-
EBITDA Margin stood at 29.09%, compared with 29.75% in Q1 FY26 and 35.01% in Q4 FY26, declining by 0.66 percentage points YoY and 5.92 percentage points QoQ.
-
Profit After Tax (PAT) stood at ₹159.45 crore, compared with ₹145.69 crore in Q1 FY26, registering a 9.44% YoY increase. Compared with ₹192.51 crore in Q4 FY26, PAT declined 17.17% QoQ.
-
PAT Margin stood at 20.36%, compared with 20.61% in Q1 FY26 and 24.31% in Q4 FY26, declining by 0.25 percentage points YoY and 3.94 percentage points QoQ.
-
EPS stood at ₹48.93, compared with ₹44.71 in Q1 FY26, increasing by ₹4.22 YoY. Compared with ₹59.08 in Q4 FY26, EPS declined by ₹10.15 QoQ.
|
Metric |
Q1 FY27 |
Q4 FY26 |
QoQ % |
Q1 FY26 |
YoY % |
|---|---|---|---|---|---|
|
Revenue from Operations (₹ Cr) |
783.02 |
792.00 |
-1.13% |
706.72 |
10.80% |
|
Total Revenue (₹ Cr) |
788.24 |
796.98 |
-1.10% |
713.40 |
10.49% |
|
EBITDA (₹ Cr) |
227.79 |
277.27 |
-17.85% |
210.25 |
8.34% |
|
EBITDA Margin |
29.09% |
35.01% |
-5.92% |
29.75% |
-0.66% |
|
PAT (₹ Cr) |
159.45 |
192.51 |
-17.17% |
145.69 |
9.44% |
|
PAT Margin |
20.36% |
24.31% |
-3.94% |
20.61% |
-0.25% |
|
EPS (₹) |
48.93 |
59.08 |
-17.18% |
44.71 |
9.44% |
Gillette India Q1 FY27 Segment-wise Revenue
Gillette India reported mixed performance across its business segments during the quarter. The Grooming segment remained the largest revenue contributor despite a sequential decline, while the Oral Care segment delivered healthy growth on both a sequential and year-on-year basis.
|
Segment Revenue |
Q1 FY27 |
Q4 FY26 |
QoQ % |
Q1 FY26 |
YoY % |
|---|---|---|---|---|---|
|
Grooming (₹ Cr) |
628.65 |
653.26 |
-3.77% |
576.93 |
8.96% |
|
Oral Care (₹ Cr) |
154.37 |
138.74 |
11.27% |
129.79 |
18.94% |
|
Total Segment Revenue (₹ Cr) |
783.02 |
792.00 |
-1.13% |
706.72 |
10.80% |
Source: Gillette India Q1 FY27 Financial Results.