
DLF Q1 Results 2027: Revenue Declines 53% YoY, PAT Rises 4% to ₹794 Cr
DLF reported a mixed Q1 FY27 performance as revenue declined sharply due to lower real estate sales, while higher other income and joint venture contribution supported profit growth.

DLF Q1 Results FY2027: India's leading real estate developer DLF reported a weak operating performance in Q1 FY27, with revenue from operations impacted by lower real estate segment revenue. However, higher contribution from joint ventures and strong other income supported profitability, helping the company post a marginal YoY growth in Profit After Tax (PAT).
DLF Q1 Results FY2027: On 3 August 2026, DLF announced its financial results for the first quarter ended 30 June 2026. Revenue from Operations declined 52.87% YoY to ₹1,280 crore, while Profit After Tax (PAT) increased 4.09% YoY to ₹794 crore compared with ₹763 crore in Q1 FY26. EBITDA Margin stood at 11.74% during the quarter.
DLF share price closed at 1.40% on 3rd Aug 2026. DLF stock has delivered -3% year to date and -14% returns over the one year from 3rd Aug 2025 to 3rd Aug 2026.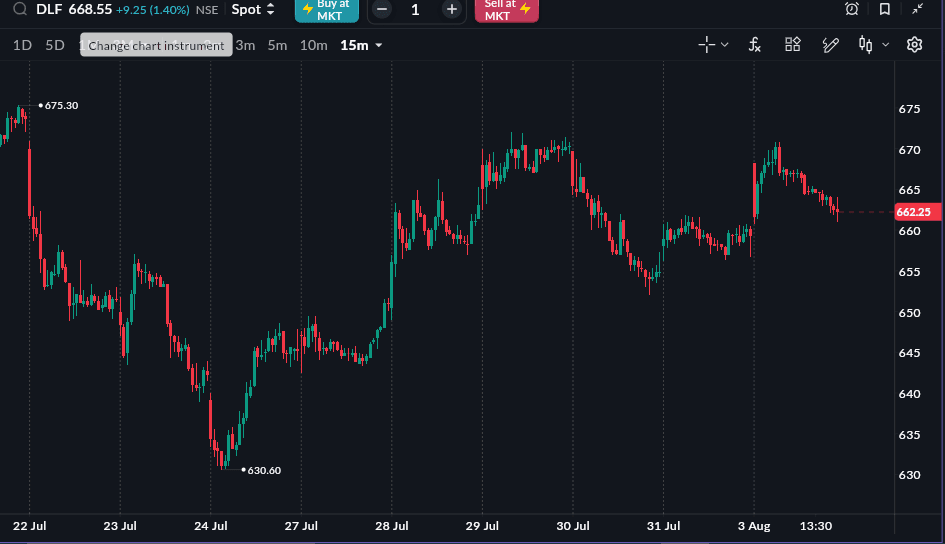
As of 3 Aug, 3:30 PM
READ THIS: MV Electrosystems IPO Allotment Status
DLF Q1 FY27 Results Highlights
-
Revenue from Operations stood at ₹1,280 crore, registering a 52.87% YoY decline from ₹2,717 crore. Compared with ₹1,814 crore in Q4 FY26, revenue declined 29.42% QoQ.
-
Total Revenue stood at ₹1,606 crore, registering a 46.14% YoY decline from ₹2,981 crore. Compared with ₹2,094 crore in Q4 FY26, total revenue declined 23.32% QoQ.
-
EBITDA (Excluding Other Income) stood at ₹150 crore, compared with ₹364 crore in Q1 FY26, registering a 58.73% YoY decline. Compared with ₹411 crore in Q4 FY26, EBITDA declined 63.41% QoQ.
-
EBITDA Margin stood at 11.74%, compared with 13.40% in Q1 FY26 and 22.64% in Q4 FY26, declining by 1.67 percentage points YoY and 10.90 percentage points QoQ.
-
Profit After Tax (PAT) stood at ₹794 crore, compared with ₹763 crore in Q1 FY26, registering a 4.09% YoY increase. Compared with ₹1,269 crore in Q4 FY26, PAT declined 37.42% QoQ.
-
PAT Margin stood at 62.01%, compared with 28.07% in Q1 FY26 and 69.93% in Q4 FY26, improving by 33.93 percentage points YoY but declining by 7.92 percentage points QoQ.
-
EPS stood at ₹3.21, compared with ₹3.08 in Q1 FY26 and ₹5.12 in Q4 FY26, increasing 4.22% YoY and declining 37.30% QoQ.
|
Metric |
Q1 FY27 |
Q4 FY26 |
QoQ % |
Q1 FY26 |
YoY % |
|---|---|---|---|---|---|
|
Revenue from Operations (₹ Cr) |
1,280 |
1,814 |
-29.42% |
2,717 |
-52.87% |
|
Total Revenue (₹ Cr) |
1,606 |
2,094 |
-23.32% |
2,981 |
-46.14% |
|
EBITDA (Excl. Other Income) (₹ Cr) |
150 |
411 |
-63.41% |
364 |
-58.73% |
|
EBITDA Margin |
11.74% |
22.64% |
-10.90 ppt |
13.40% |
-1.67 ppt |
|
PAT (₹ Cr) |
794 |
1,269 |
-37.42% |
763 |
4.09% |
|
PAT Margin |
62.01% |
69.93% |
-7.92 ppt |
28.07% |
+33.93 ppt |
|
EPS (₹) |
3.21 |
5.12 |
-37.30% |
3.08 |
4.22% |
DLF Q1 Segment-wise Performance
DLF's Real Estate segment revenue stood at ₹1,141 crore in Q1 FY27, registering a 55.89% YoY decline from ₹2,587 crore. Compared with ₹1,658 crore in Q4 FY26, Real Estate revenue declined 31.19% QoQ. Rental business revenue remained resilient, increasing 8.13% YoY to ₹146 crore, supported by stable rental income.
|
Segment |
Q1 FY27 (₹ Cr) |
Q4 FY26 (₹ Cr) |
QoQ % |
Q1 FY26 (₹ Cr) |
YoY % |
|---|---|---|---|---|---|
|
Real Estate |
1,141 |
1,658 |
-31.19% |
2,587 |
-55.89% |
|
Rental |
146 |
163 |
-10.42% |
135 |
8.13% |
|
Less: Inter Segment Revenue |
6 |
7 |
— |
5 |
— |
|
Total Revenue from Operations |
1,280 |
1,814 |
-29.42% |
2,717 |
-52.87% |
Source: Company Filing
All topics
Click the link, confirm the box next to sahi.com is checked — ignore any other results.