
Bharti Airtel Q1 Results FY2027: Revenue Rises 18% YoY, PAT Increases 35% to ₹10,012 Cr
Bharti Airtel reported strong Q1 FY27 results with double-digit growth in revenue and profit, driven by solid performance across India mobile, Africa, home broadband, and enterprise businesses.

Bharti Airtel Q1 Results FY2027: Bharti Airtel reported a strong performance in Q1 FY27, driven by healthy growth across its India mobile, Africa, home broadband and enterprise businesses. Continued customer additions and operating leverage supported margin expansion, while PAT grew 35% YoY.
Bharti Airtel Q1 Results FY2027: On 4 August 2026, Bharti Airtel announced its financial results for the first quarter ended 30 June 2026. Revenue from Operations increased 18.35% YoY to ₹58,539 crore compared with ₹49,463 crore in Q1 FY26,
While Profit After Tax (PAT) increased 34.89% YoY to ₹10,012 crore compared with ₹7,422 crore in Q1 FY26. EBITDA Margin stood at 56.89% during the quarter.
Bharti Airtel share price closed at -0.02% lower on 4 August 2026. The stock has delivered -7% returns year-to-date and 3% returns over the one year from 4 August 2025 to 4 August 2026.
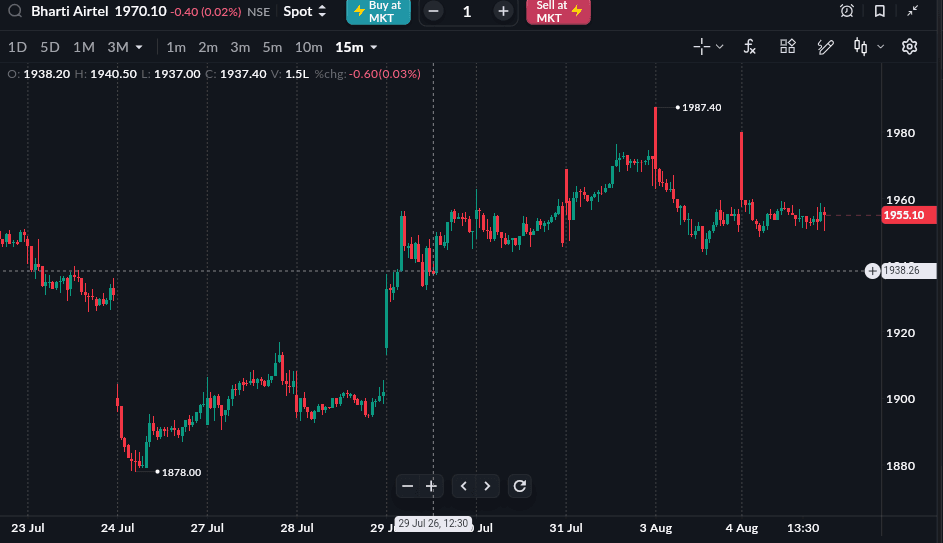
As of 4 Aug, 3:30 PM
READ THIS ALSO: Nykaa Q1 Results 2027
Bharti Airtel Q1 FY27 Results Highlights
-
Revenue from Operations stood at ₹58,539 crore, registering an 18.35% YoY increase from ₹49,463 crore in Q1 FY26. Compared with ₹55,383 crore in Q4 FY26, revenue increased 5.70% QoQ.
-
Total Revenue stood at ₹59,446 crore, registering an 18.96% YoY increase from ₹49,971 crore in Q1 FY26. Compared with ₹56,262 crore in Q4 FY26, total revenue increased 5.66% QoQ.
-
EBITDA (Excluding Other Income) stood at ₹33,303 crore, compared with ₹27,839 crore in Q1 FY26, registering a 19.63% YoY increase. Compared with ₹31,492 crore in Q4 FY26, EBITDA increased 5.75% QoQ.
-
EBITDA Margin stood at 56.89%, compared with 56.28% in Q1 FY26 and 56.86% in Q4 FY26, improving by 0.61 percentage points YoY and 0.03 percentage points QoQ.
-
Profit After Tax (PAT) stood at ₹10,012 crore, compared with ₹7,422 crore in Q1 FY26, registering a 34.89% YoY increase. Compared with ₹9,247 crore in Q4 FY26, PAT increased 8.26% QoQ.
-
PAT Margin stood at 17.10%, compared with 15.00% in Q1 FY26 and 16.70% in Q4 FY26, improving by 2.10 percentage points YoY and 0.41 percentage points QoQ.
-
Profit After Tax attributable to owners of the company stood at ₹8,167 crore, compared with ₹5,948 crore in Q1 FY26, registering a 37.32% YoY increase. Compared with ₹7,325 crore in Q4 FY26, PAT attributable to owners increased 11.50% QoQ.
-
EPS stood at ₹13.38, compared with ₹10.26 in Q1 FY26 and ₹12.53 in Q4 FY26, increasing 30.41% YoY and 6.78% QoQ.
|
Metric |
Q1 FY27 |
Q4 FY26 |
QoQ % |
Q1 FY26 |
YoY % |
|---|---|---|---|---|---|
|
Revenue from Operations (₹ Cr) |
58,539 |
55,383 |
5.70% |
49,463 |
18.35% |
|
Total Revenue (₹ Cr) |
59,446 |
56,262 |
5.66% |
49,971 |
18.96% |
|
EBITDA (Excl. Other Income) (₹ Cr) |
33,303 |
31,492 |
5.75% |
27,839 |
19.63% |
|
EBITDA Margin |
56.89% |
56.86% |
+0.03 pp |
56.28% |
+0.61 pp |
|
PAT (₹ Cr) |
10,012 |
9,247 |
8.26% |
7,422 |
34.89% |
|
PAT Margin |
17.10% |
16.70% |
+0.41 pp |
15.00% |
+2.10 pp |
|
PAT Attributable to Owners (₹ Cr) |
8,167 |
7,325 |
11.50% |
5,948 |
37.32% |
|
EPS (₹) |
13.38 |
12.53 |
6.78% |
10.26 |
30.41% |
Bharti Airtel Q1 Segment-wise Performance
Bharti Airtel reported broad-based growth across its businesses during Q1 FY27. The India mobile business remained the largest revenue contributor, while the Africa operations and Home Services business delivered the strongest year-on-year growth. Airtel Business and Passive Infrastructure Services also recorded steady growth during the quarter.
|
Segment (Cr) |
Q1 FY27 |
Q4 FY26 |
QoQ % |
Q1 FY26 |
YoY % |
|---|---|---|---|---|---|
|
Mobile Services – India |
29,928.9 |
28,830.5 |
3.81% |
27,396.6 |
9.24% |
|
Mobile Services – Africa |
17,565.7 |
16,034.0 |
9.56% |
12,083.4 |
45.37% |
|
Airtel Business |
5,665.4 |
5,490.0 |
3.19% |
5,057.1 |
12.03% |
|
Passive Infrastructure Services |
8,525.4 |
8,201.0 |
3.96% |
8,091.3 |
5.37% |
|
Home Services |
2,287.5 |
2,191.0 |
4.39% |
1,717.9 |
33.16% |
|
Digital TV Services |
773.4 |
747.0 |
3.58% |
762.8 |
1.39% |
|
Others |
96.8 |
93.4 |
3.64% |
107.8 |
-10.20% |
|
Less: Inter Segment Revenue |
6,304.0 |
6,204.0 |
— |
5,754.3 |
— |
|
Total Revenue from Operations |
58,539.1 |
55,383.2 |
5.70% |
49,462.6 |
18.35% |
Source: Company Filing
All topics
Click the link, confirm the box next to sahi.com is checked — ignore any other results.