
Aurobindo Pharma Q1 Results 2027: Revenue Rises 16% YoY, PAT Jumps 25% to ₹1,032 Cr
Aurobindo Pharma reports strong Q1 FY27 results as revenue rises 16% YoY and net profit grows 25%, supported by margin expansion.

Aurobindo Pharma Q1 Results FY2027: Aurobindo Pharma reported a strong performance in Q1 FY27, supported by healthy revenue growth and improved operating performance. Expansion in margins and better profitability resulted in a strong increase in net profit during the quarter.
Aurobindo Pharma Q1 Results FY2027: On 5 August 2026, Aurobindo Pharma announced its financial results for the first quarter ended 30 June 2026. Revenue from Operations increased 16.30% YoY to ₹9,150 crore compared with ₹7,868 crore in Q1 FY26.
While Profit After Tax (PAT) increased 25.22% YoY to ₹1,032 crore compared with ₹824 crore in Q1 FY26. EBITDA Margin stood at 20.56% during the quarter.
Aurobindo Pharma share price closed 1.73% higher on 5 August 2026. The stock has delivered 35% returns year-to-date and 50% returns over the one year from 5 August 2025 to 5 August 2026.
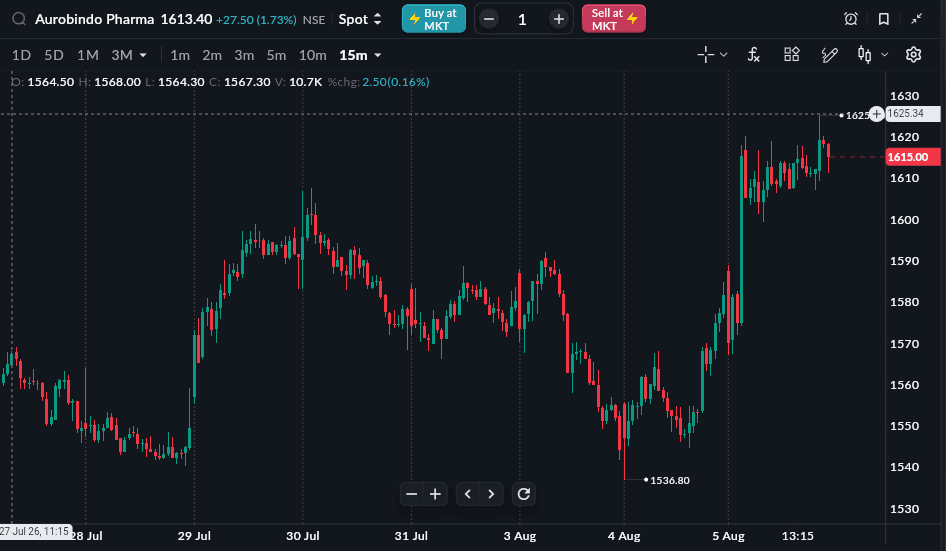
As of 5 Aug, 3:30 PM
READ THIS: PB Fintech Q1 Results 2027
Aurobindo Pharma Q1 FY27 Results Highlights
-
Revenue from Operations stood at ₹9,150 crore, registering a 16.30% YoY increase from ₹7,868 crore in Q1 FY26. Compared with ₹8,853 crore in Q4 FY26, revenue increased 3.35% QoQ.
-
Total Revenue stood at ₹9,415 crore, registering an 18.07% YoY increase from ₹7,973 crore in Q1 FY26. Compared with ₹8,970 crore in Q4 FY26, total revenue increased 4.95% QoQ.
-
EBITDA (Excluding Other Income) stood at ₹1,881 crore, compared with ₹1,603 crore in Q1 FY26, registering a 17.34% YoY increase. Compared with ₹1,753 crore in Q4 FY26, EBITDA increased 7.32% QoQ.
-
EBITDA Margin stood at 20.56%, compared with 20.37% in Q1 FY26 and 19.80% in Q4 FY26, improving by 0.18 percentage points YoY and 0.76 percentage points QoQ.
-
Profit After Tax (PAT) stood at ₹1,032 crore, compared with ₹824 crore in Q1 FY26, registering a 25.22% YoY increase. Compared with ₹921 crore in Q4 FY26, PAT increased 12.07% QoQ.
-
PAT Margin stood at 11.28%, compared with 10.48% in Q1 FY26 and 10.40% in Q4 FY26, improving by 0.80 percentage points YoY and 0.88 percentage points QoQ.
-
Profit After Tax attributable to owners of the company stood at ₹1,033 crore, compared with ₹825 crore in Q1 FY26, registering a 25.20% YoY increase. Compared with ₹921 crore in Q4 FY26, PAT attributable to owners increased 12.08% QoQ.
-
EPS stood at ₹17.86, compared with ₹14.20 in Q1 FY26 and ₹15.86 in Q4 FY26, increasing 25.77% YoY and 12.61% QoQ.
|
Metric |
Q1 FY27 |
Q4 FY26 |
QoQ % |
Q1 FY26 |
YoY % |
|---|---|---|---|---|---|
|
Revenue from Operations (₹ Cr) |
9,150 |
8,853 |
3.35% |
7,868 |
16.30% |
|
Total Revenue (₹ Cr) |
9,415 |
8,970 |
4.95% |
7,973 |
18.07% |
|
EBITDA (₹ Cr) |
1,881 |
1,753 |
7.32% |
1,603 |
17.34% |
|
EBITDA Margin |
20.56% |
19.80% |
+0.76 pp |
20.37% |
+0.18 pp |
|
PAT (₹ Cr) |
1,032 |
921 |
12.07% |
824 |
25.22% |
|
PAT Margin |
11.28% |
10.40% |
+0.88 pp |
10.48% |
+0.80 pp |
|
PAT (Owners) (₹ Cr) |
1,033 |
921 |
12.08% |
825 |
25.20% |
|
EPS (₹) |
17.86 |
15.86 |
12.61% |
14.20 |
25.77% |
Source: Company Filing
All topics
Click the link, confirm the box next to sahi.com is checked — ignore any other results.