
Asian Paints Q1 Results 2027: PAT Jumps 40% YoY, Revenue Up 18%
Asian Paints reported a strong Q1 FY27 performance, with revenue from operations rising 17.94% YoY and profit for the period increasing 39.60%, supported by healthy growth across domestic, international and industrial businesses.

Asian Paints Q1 Results FY2027: Asian Paints reported a strong performance for Q1 FY27, with Profit After Tax (PAT) rising to ₹1,559.45 crore and Revenue from Operations increasing to ₹10,541.94 crore. The company also delivered healthy operating performance, with EBITDA margin expanding by 2.39 percentage points YoY.
Asian Paints Q1 Results FY2027: On 29 July 2026, Asian Paints announced its financial results for the first quarter ended June 30, 2026. Revenue from Operations grew 17.94% YoY to ₹10,541.94 crore, while Profit After Tax (PAT) increased 39.60% YoY to ₹1,559.45 crore.
Just after the results, Asian Paints share price is up 1.46% at the time of writing. Asian Paints stock is up 0.98% year-to-date and up 15.72% in one year from 29 July 2025 to 29 July 2026
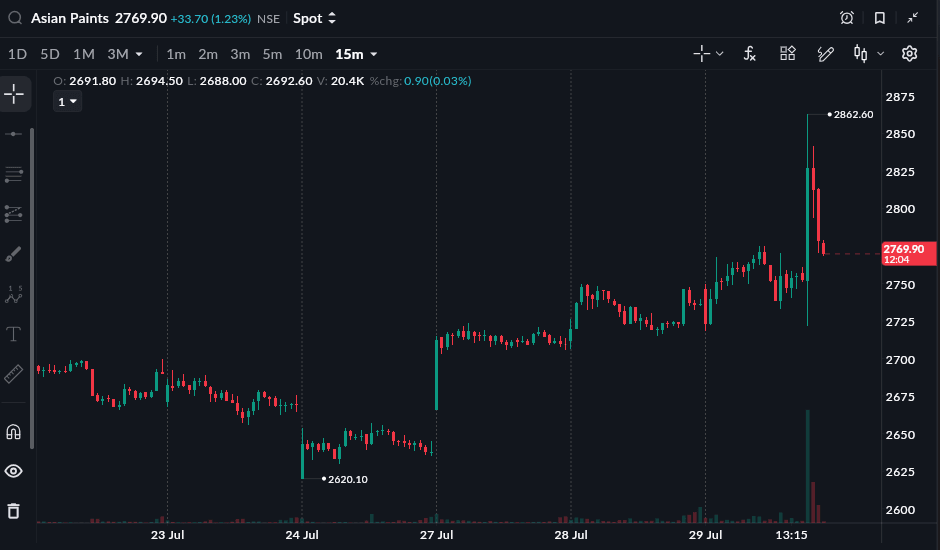
As of 29 July, 2:44 PM
READ THIS ALSO: Adani Ports Q1 Results 2027
Asian Paints Q1 FY27 Results Highlights (Consolidated)
-
Revenue from Operations stood at ₹10,541.94 crore, up 17.94% YoY from ₹8,938.55 crore. Compared with ₹9,246.70 crore in Q4 FY26, revenue increased 14.01% QoQ.
-
Total Revenue stood at ₹10,782.79 crore, registering an 18.09% YoY increase from ₹9,131.34 crore in Q1 FY26. Compared with ₹9,418.07 crore in Q4 FY26, total revenue increased 14.49% QoQ.
-
EBITDA stood at ₹2,168.76 crore, registering a 33.46% YoY increase from ₹1,624.97 crore. Compared with ₹1,786.61 crore in Q4 FY26, EBITDA increased 21.39% QoQ.
-
EBITDA Margin stood at 20.57%, compared with 18.18% in Q1 FY26 and 19.32% in Q4 FY26, improving by 2.39 percentage points YoY and 1.25 percentage points QoQ.
-
Profit After Tax (PAT) stood at ₹1,559.45 crore, compared with ₹1,117.05 crore in Q1 FY26, registering a 39.60% YoY increase. Compared with ₹1,185.49 crore in Q4 FY26, PAT increased 31.54% QoQ.
-
PAT Margin stood at 14.79%, compared with 12.50% in Q1 FY26 and 12.82% in Q4 FY26, improving by 2.30 percentage points YoY and 1.97 percentage points QoQ.
-
EPS stood at ₹16.06, compared with ₹11.47 in Q1 FY26, increasing by ₹4.59 YoY. Compared with ₹12.23 in Q4 FY26, EPS increased by ₹3.83 QoQ.
|
Metric |
Q1 FY27 |
Q4 FY26 |
QoQ % |
Q1 FY26 |
YoY % |
|---|---|---|---|---|---|
|
Revenue from Operations (₹ Cr) |
10,541.94 |
9,246.70 |
14.01% |
8,938.55 |
17.94% |
|
Total Revenue (₹ Cr) |
10,782.79 |
9,418.07 |
14.49% |
9,131.34 |
18.09% |
|
EBITDA (₹ Cr) |
2,168.76 |
1,786.61 |
21.39% |
1,624.97 |
33.46% |
|
EBITDA Margin |
20.57% |
19.32% |
1.25% |
18.18% |
2.39% |
|
Profit for the period (₹ Cr) |
1,559.45 |
1,185.49 |
31.54% |
1,117.05 |
39.60% |
|
PAT Margin |
14.79% |
12.82% |
1.97% |
12.50% |
2.30% |
|
EPS (₹) |
16.06 |
12.23 |
31.32% |
11.47 |
40.02% |
Source: Asian Paints Q1 FY27 Financial Results.
Asian Paints Q1 Segment-wise Performance
-
International Business: Net sales grew 27.2% YoY to ₹936.5 crore from ₹736.1 crore, driven by Egypt, UAE, Oman, Nepal, and Bangladesh. Constant currency sales rose 20.3%, while PBT jumped 94.9% to ₹74.1 crore.
-
Bath Fittings: Net sales declined 4.3% YoY to ₹84.9 crore from ₹88.7 crore. Loss before tax widened to ₹8.8 crore from ₹2.3 crore in the same period of the previous year
-
Kitchen Business: Net sales increased 10.1% YoY to ₹108.0 crore from ₹98.1 crore in Q1 FY26. Loss before tax narrowed to ₹0.3 crore from ₹8.8 crore in Q1 FY26
-
White Teak & Weatherseal: White Teak sales fell 7.4% to ₹18.7 crore in Q1 FY27, while Weatherseal sales increased 11.2% to ₹16.9 crore.
-
APPPG: Net sales rose 21.3% YoY to ₹372.9 crore from ₹307.4 crore in Q1 FY26. PBT increased to ₹25.8 crore from ₹24.8 crore.
-
PPGAP: Net sales grew 13.5% YoY to ₹651.9 crore from ₹574.5 crore. PBT improved to ₹102.7 crore from ₹97.3 crore in Q1 FY26