
Sahi Just Added 40+ New Indicators. But That’s Not the Real Story
Why combining momentum, volatility, volume, and risk matters more than adding another indicator
Most traders don’t lack effort. They lack visibility.
You can spend hours staring at charts, add a couple of indicators, take trades with conviction and still feel like something is missing. That “something” is usually not a better strategy. It’s a missing layer of context.
Markets don’t move in isolation. Price moves with momentum. Momentum shifts with participation. Volatility expands and contracts constantly. And yet, most traders end up analysing just one of these at a time.
That’s the gap SAHI is trying to close.
With the latest release of 40+ new indicators, the platform now offers more than 100 indicators across categories. But the significance of this update isn’t in the number. It’s in what that number enables a more complete way of reading the market.
How the New Indicators Are Structured
The 40 new indicators are not random additions.
They are grouped around how traders actually make decisions.
1. Entry Timing & Intraday Precision
A common challenge for traders is entering too late or chasing moves after they’ve already begun.
Indicators like VWAP with Bands, Squeeze Momentum, Stochastic RSI, and WaveTrend shift the focus to what happens before a move expands. VWAP provides a reference for fair value, often acting as a level around which institutional activity clusters. Squeeze Momentum highlights periods of compression that typically precede expansion, while Stochastic RSI accelerates momentum signals for quicker entries.

Instead of reacting to moves after they’ve played out, you begin identifying the conditions that signal a move is about to start.
2. Risk Management & Exit Systems
One of the most common weaknesses in trading is inconsistent stop placement. Many traders rely on visual levels or instinct, while markets move based on volatility.
Indicators such as Volatility Stop, Chande Kroll Stop, and Price Channel bring structure to this process by aligning exits with actual market behaviour. As volatility increases, stops naturally widen; as conditions stabilise, they tighten.
This changes how you think about exits. Instead of asking where to place a stop, the focus shifts to identifying the point at which the trade no longer holds where it is objectively invalid.
3. Momentum & Signal Quality
One of the biggest challenges with momentum indicators is noise. Traditional tools often generate too many signals, leading to overtrading and inconsistent results.
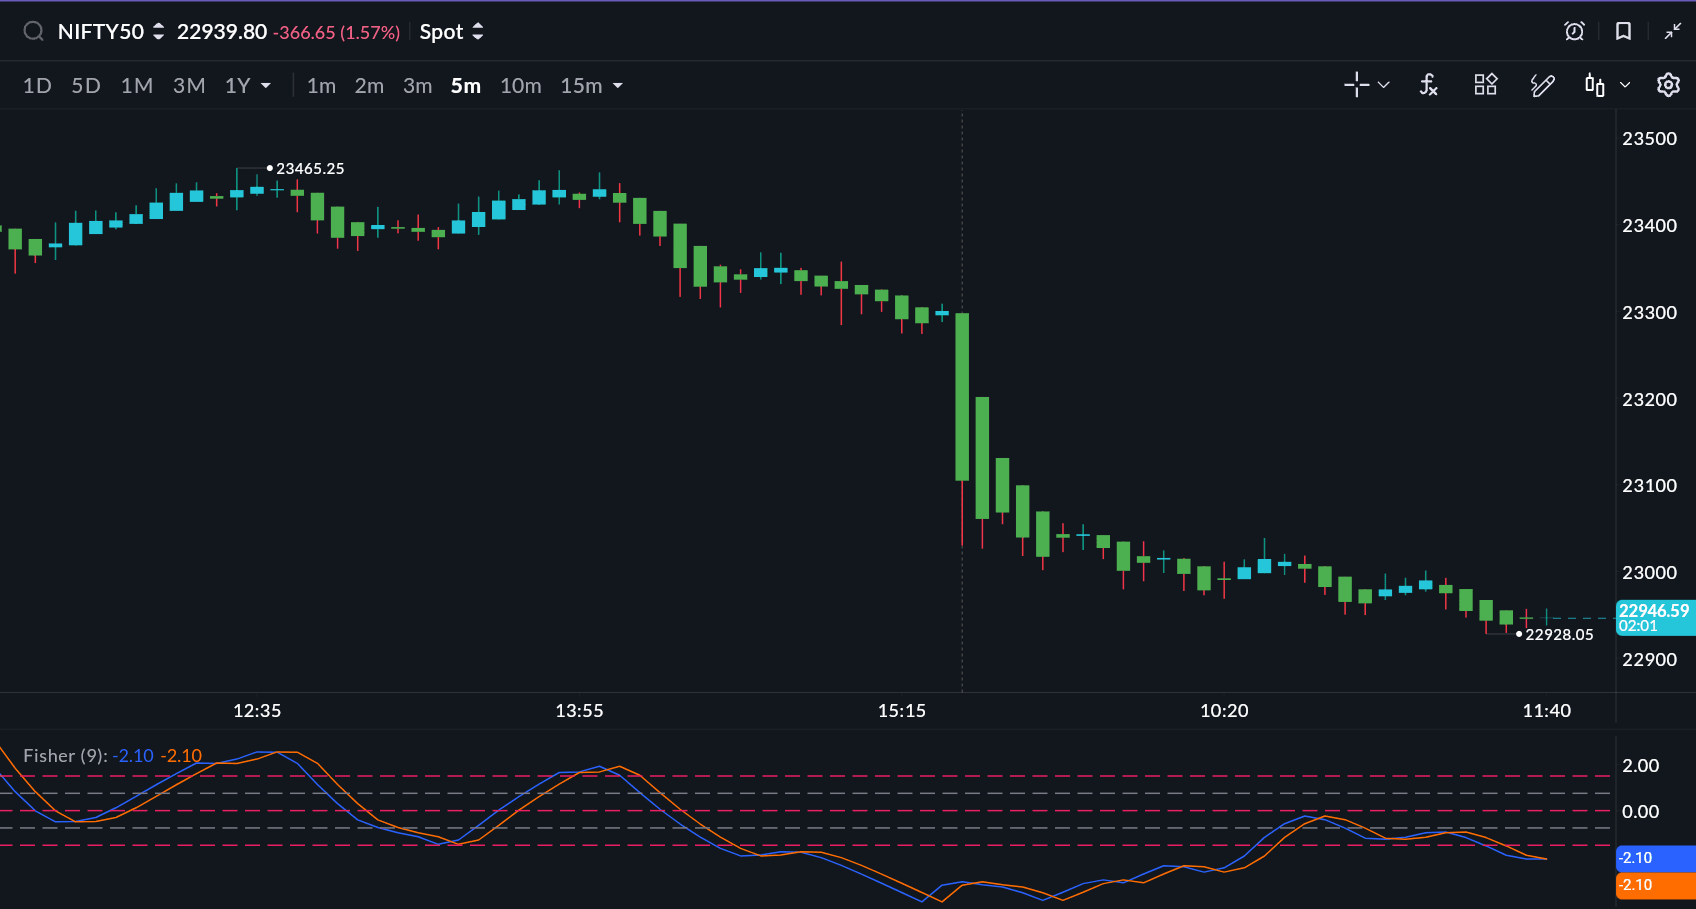
Indicators like Connors RSI, True Strength Index, Fisher Transform, and Ultimate Oscillator shift the focus from generating more signals to filtering better ones. Instead of reacting to every minor move, they help isolate meaningful shifts in momentum.
Fisher Transform makes turning points sharper and easier to identify, while TSI performs more reliably in trending markets where simpler indicators tend to break down.
The result is not more trades, but better ones fewer signals, with significantly higher quality.
4. Trend Identification & Adaptability
One of the biggest structural problems in technical analysis is lag. Traditional moving averages are inherently reactive they confirm a trend only after a significant part of the move has already played out. This is why many traders constantly feel like they are entering late.
Indicators such as Zero Lag EMA, McGinley Dynamic, and Moving Average Ribbon are designed to address exactly this limitation. Instead of applying a fixed formula to price, they adapt to the speed and behaviour of the market itself.
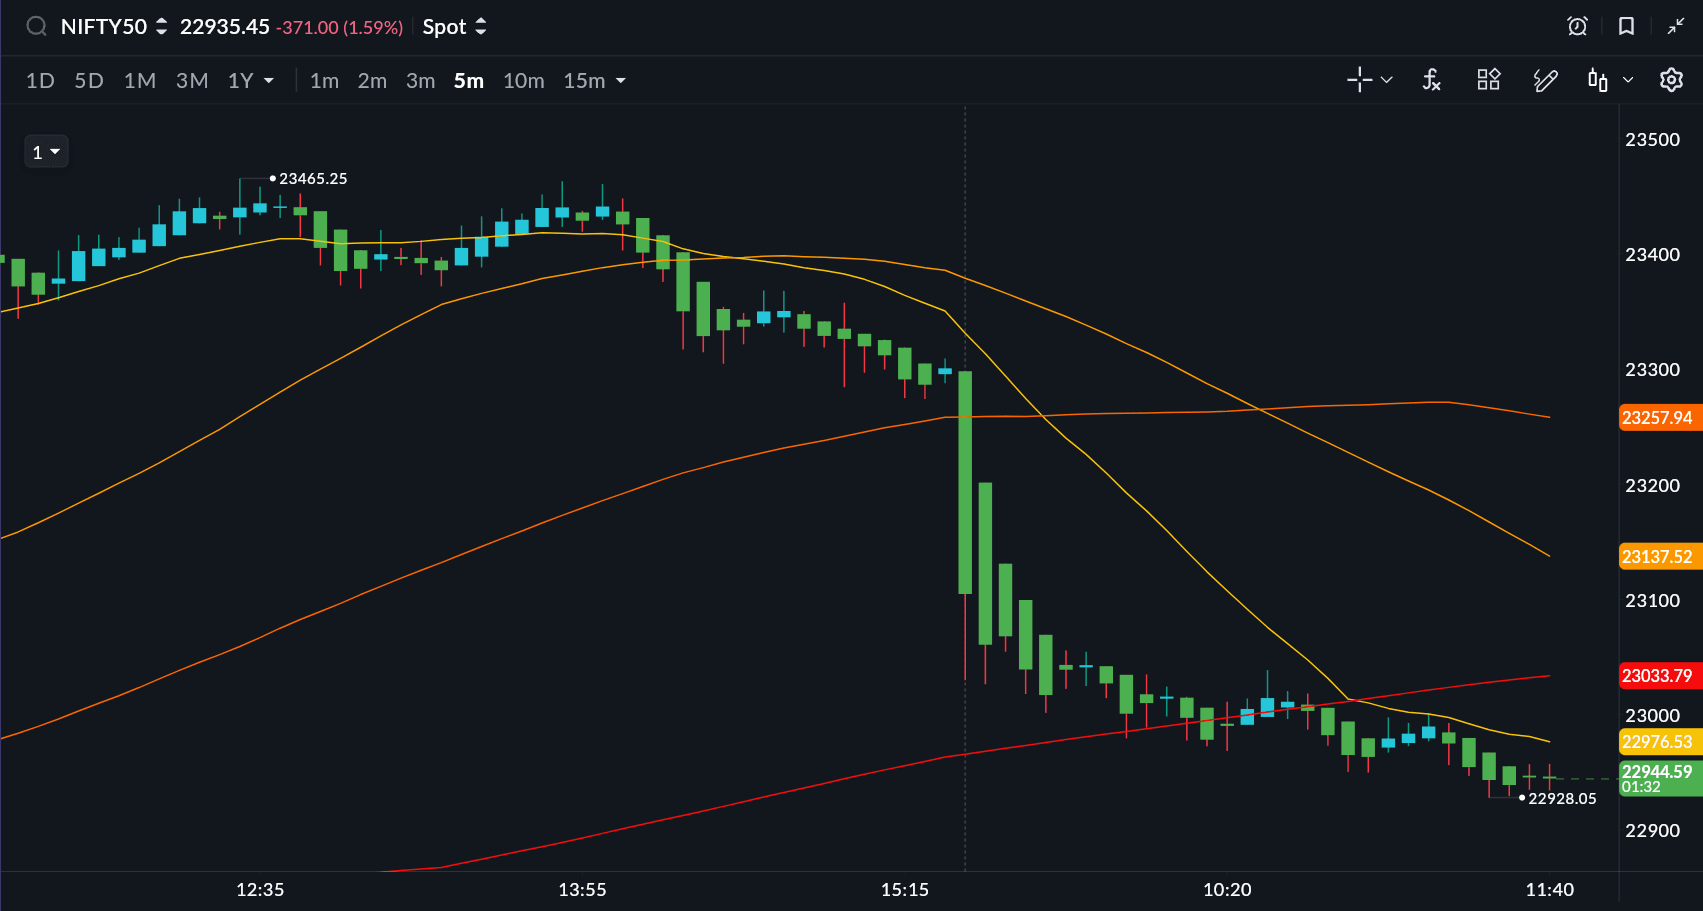
This allows you to distinguish whether a trend is still building with strength or beginning to lose momentum. The result is not just earlier entries, but also better holding decisions staying in when the trend is intact and exiting when it starts to weaken.
5. Volatility & Market Regime
Trading the wrong strategy in the wrong market is one of the most common reasons trades fail. A large portion of losses doesn’t come from bad entries, but from misreading market conditions.
Indicators like the Choppiness Index, Chop Zone, Historical Volatility, and Standard Deviation help you understand the environment before you take a trade. They allow you to distinguish between trending phases, where breakout strategies tend to work, and choppy conditions, where mean reversion or even staying out makes more sense.
This added layer of clarity can filter out a significant number of low-quality trades before they even begin.
6. Volume & Market Participation
One of the most common reasons trades fail is simple price moves without real participation rarely sustain.
A breakout might look clean on the chart, but without underlying buying or selling pressure, it often fades just as quickly. This is what leads to false breakouts and weak trends that trap traders.
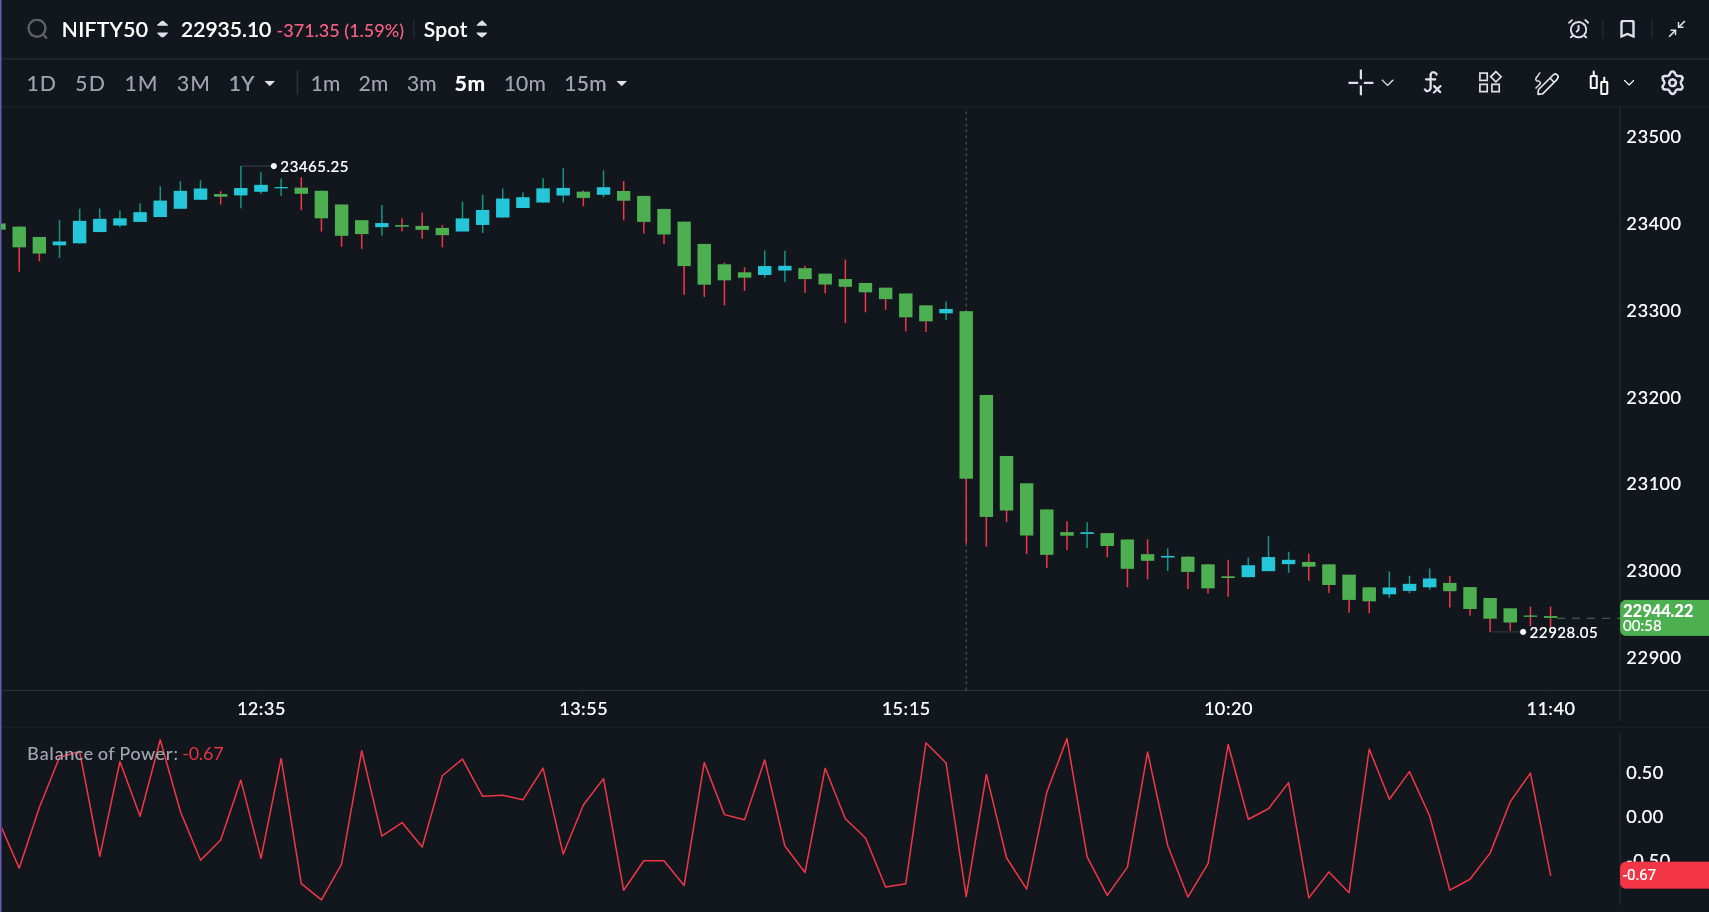
Indicators such as Net Volume, Balance of Power, and Relative Vigor Index address this gap by focusing on participation rather than just price. They help you assess whether a move is actually being supported or quietly losing strength underneath.
This becomes especially important in situations where confirmation matters most whether it’s validating a breakout, identifying a reversal, or holding onto a continuation trade.
The shift here is subtle but critical. Instead of taking price at face value, you begin to evaluate the conviction behind the move and that’s what separates reliable setups from noise.
7. Structure, Patterns & Clarity
One of the biggest issues traders run into is not a lack of tools, but too many of them. As more indicators get added, charts become cluttered, signals start conflicting, and decision-making slows down.
Indicators like Zig Zag, Vortex Indicator, Trend Strength Index, and RCI Ribbon move in the opposite direction. Instead of adding more noise, they simplify price action by focusing only on what actually matters.
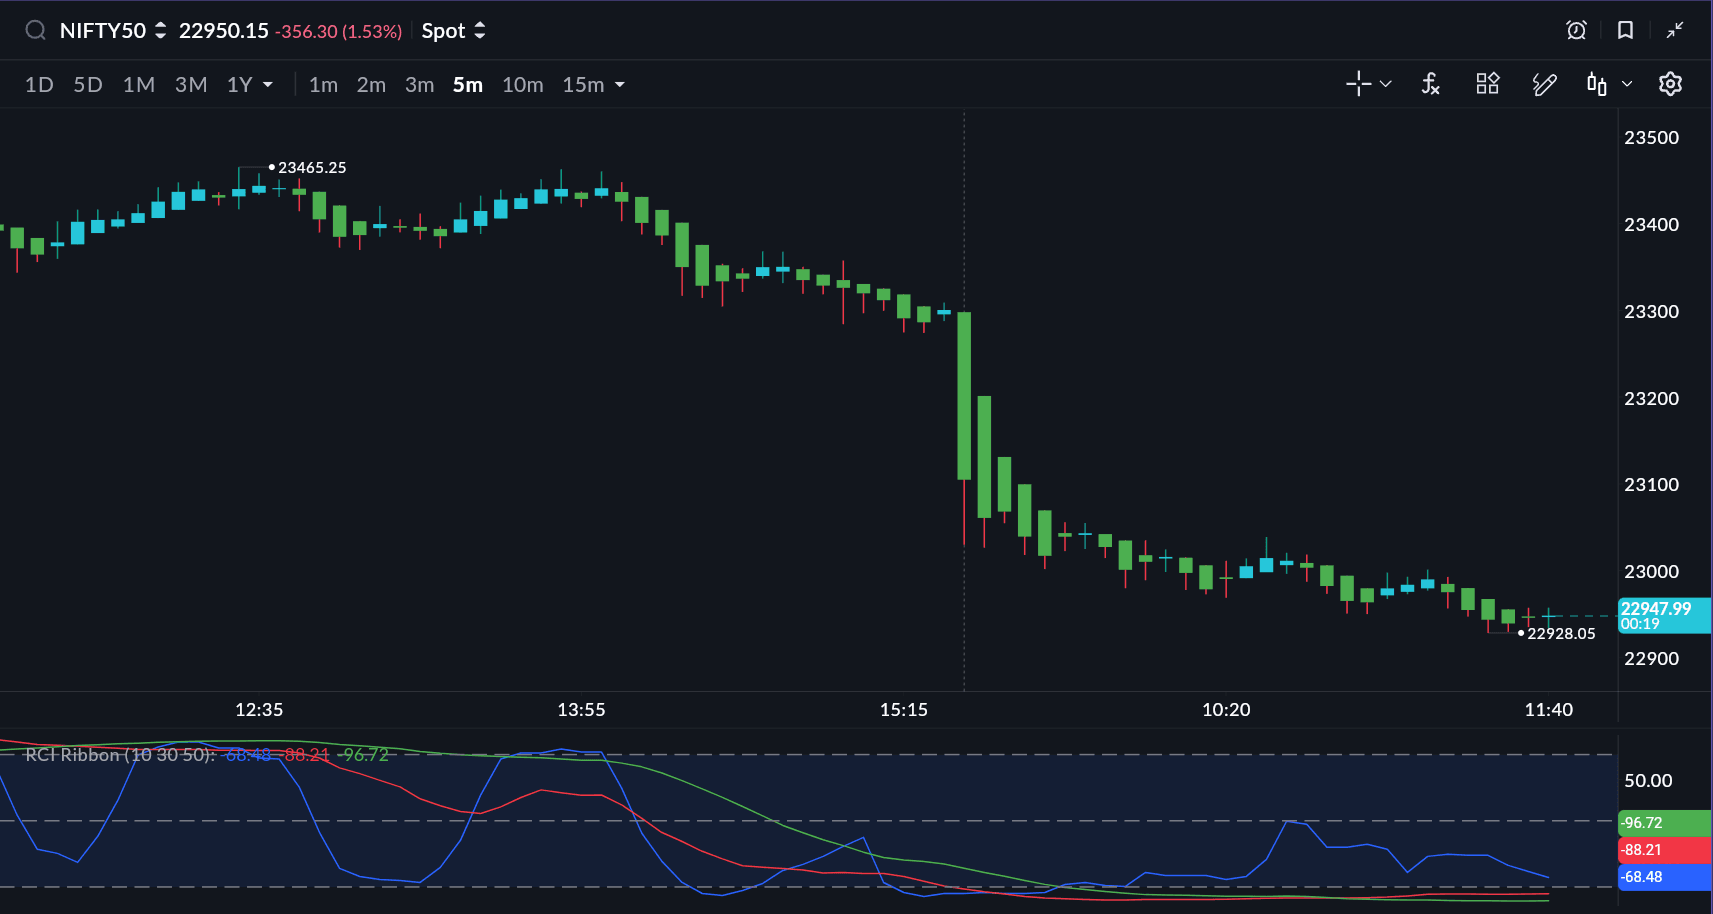
They bring attention to the core structure of the market clear swing points, the strength of direction, and how consistently price is moving within that trend.
The result is a chart that is easier to read and, more importantly, easier to act on. Decisions become quicker, cleaner, and far less dependent on guesswork.
From More Indicators to Better Decisions
This update isn’t about adding more indicators it’s about bringing everything together.
Instead of looking at trend, momentum, volatility, and risk separately, you can now evaluate them in one place. When these factors align, decisions become clearer and execution becomes cleaner.
Crossing 100+ indicators is not about choice. It’s about coverage. You no longer need to switch tools or piece together your analysis everything sits within a single system.
And that’s the real shift.
The edge in trading doesn’t come from finding one new indicator. It comes from seeing the market clearly and acting on it.
What You Should Do Next
Open SAHI. Go to charts. Build your setup with intent.
Use momentum to time entries, volatility to decide when to trade, volume to validate moves, and risk tools to define exits.
Because the advantage isn’t in more indicators.
It’s in using them better.