
Open Interest vs Change in OI: How to Read Market Direction on NSE
Open interest tracks how many F&O contracts are active. Change in OI tells you whether conviction is building or fading. Here's how to read both to understand market direction on NSE.
Open Interest (OI) is the total number of outstanding options contracts. Change in OI shows how much OI increased or decreased that day. Rising price + rising OI = bullish trend; rising price + falling OI = short covering. Traders use OI data on Nifty and Bank Nifty to identify key support/resistance levels and gauge where institutions are positioned.
Open interest (OI) is the total number of outstanding derivative contracts — futures or options — that are active and have not yet been closed, expired, or settled. It reflects the level of market participation and the scale of open positions, but it does not directly measure capital inflow or outflow.
A change in OI represents the net difference in outstanding contracts between two trading sessions. It reflects whether new positions are being created, existing ones closed, or contracts transferred between participants — but it does not independently indicate market direction. Direction only becomes meaningful when OI is read alongside price action.
This guide explains both metrics in depth and shows how to use them together to read market sentiment on the NSE.
What is Open Interest?
Open interest is the total count of active futures and options contracts for a given security at any point during the trading day. It tracks positions that have not been squared off, expired, or delivered. Because it measures outstanding contract count, it is a useful indicator of how deeply participants are engaged with a particular instrument.
Each contract has one buyer and one seller. OI counts contracts — not individual long or short positions separately. So if 1,000 contracts are open, there are 1,000 buyers and 1,000 sellers — but OI is reported as 1,000, not 2,000.
OI and trading volume are related but distinct. Volume counts every transaction during a session, including both opening and closing trades. OI only counts contracts that remain open at the end of the session. Both are useful, and they are best read together. Our detailed OI guide on SAHI covers how to read OI data directly from the NSE option chain in real time.
Example of Open Interest
Here is how OI changes across three scenarios:
- If Trader A buys a new call option from Trader B (both creating new positions), OI increases by 1.
- If Trader A then sells that call option to Trader C, OI stays the same — the contract has simply transferred from one holder to another. No new contract was created.
- If Trader B buys back the contract from Trader A to close his position, OI decreases by 1 — the contract has been closed.
The rule is simple: OI increases when both parties open a new position, decreases when both close an existing one, and stays flat when one opens while the other closes (a transfer).
Here's the Nifty50 Option Chain on SAHI.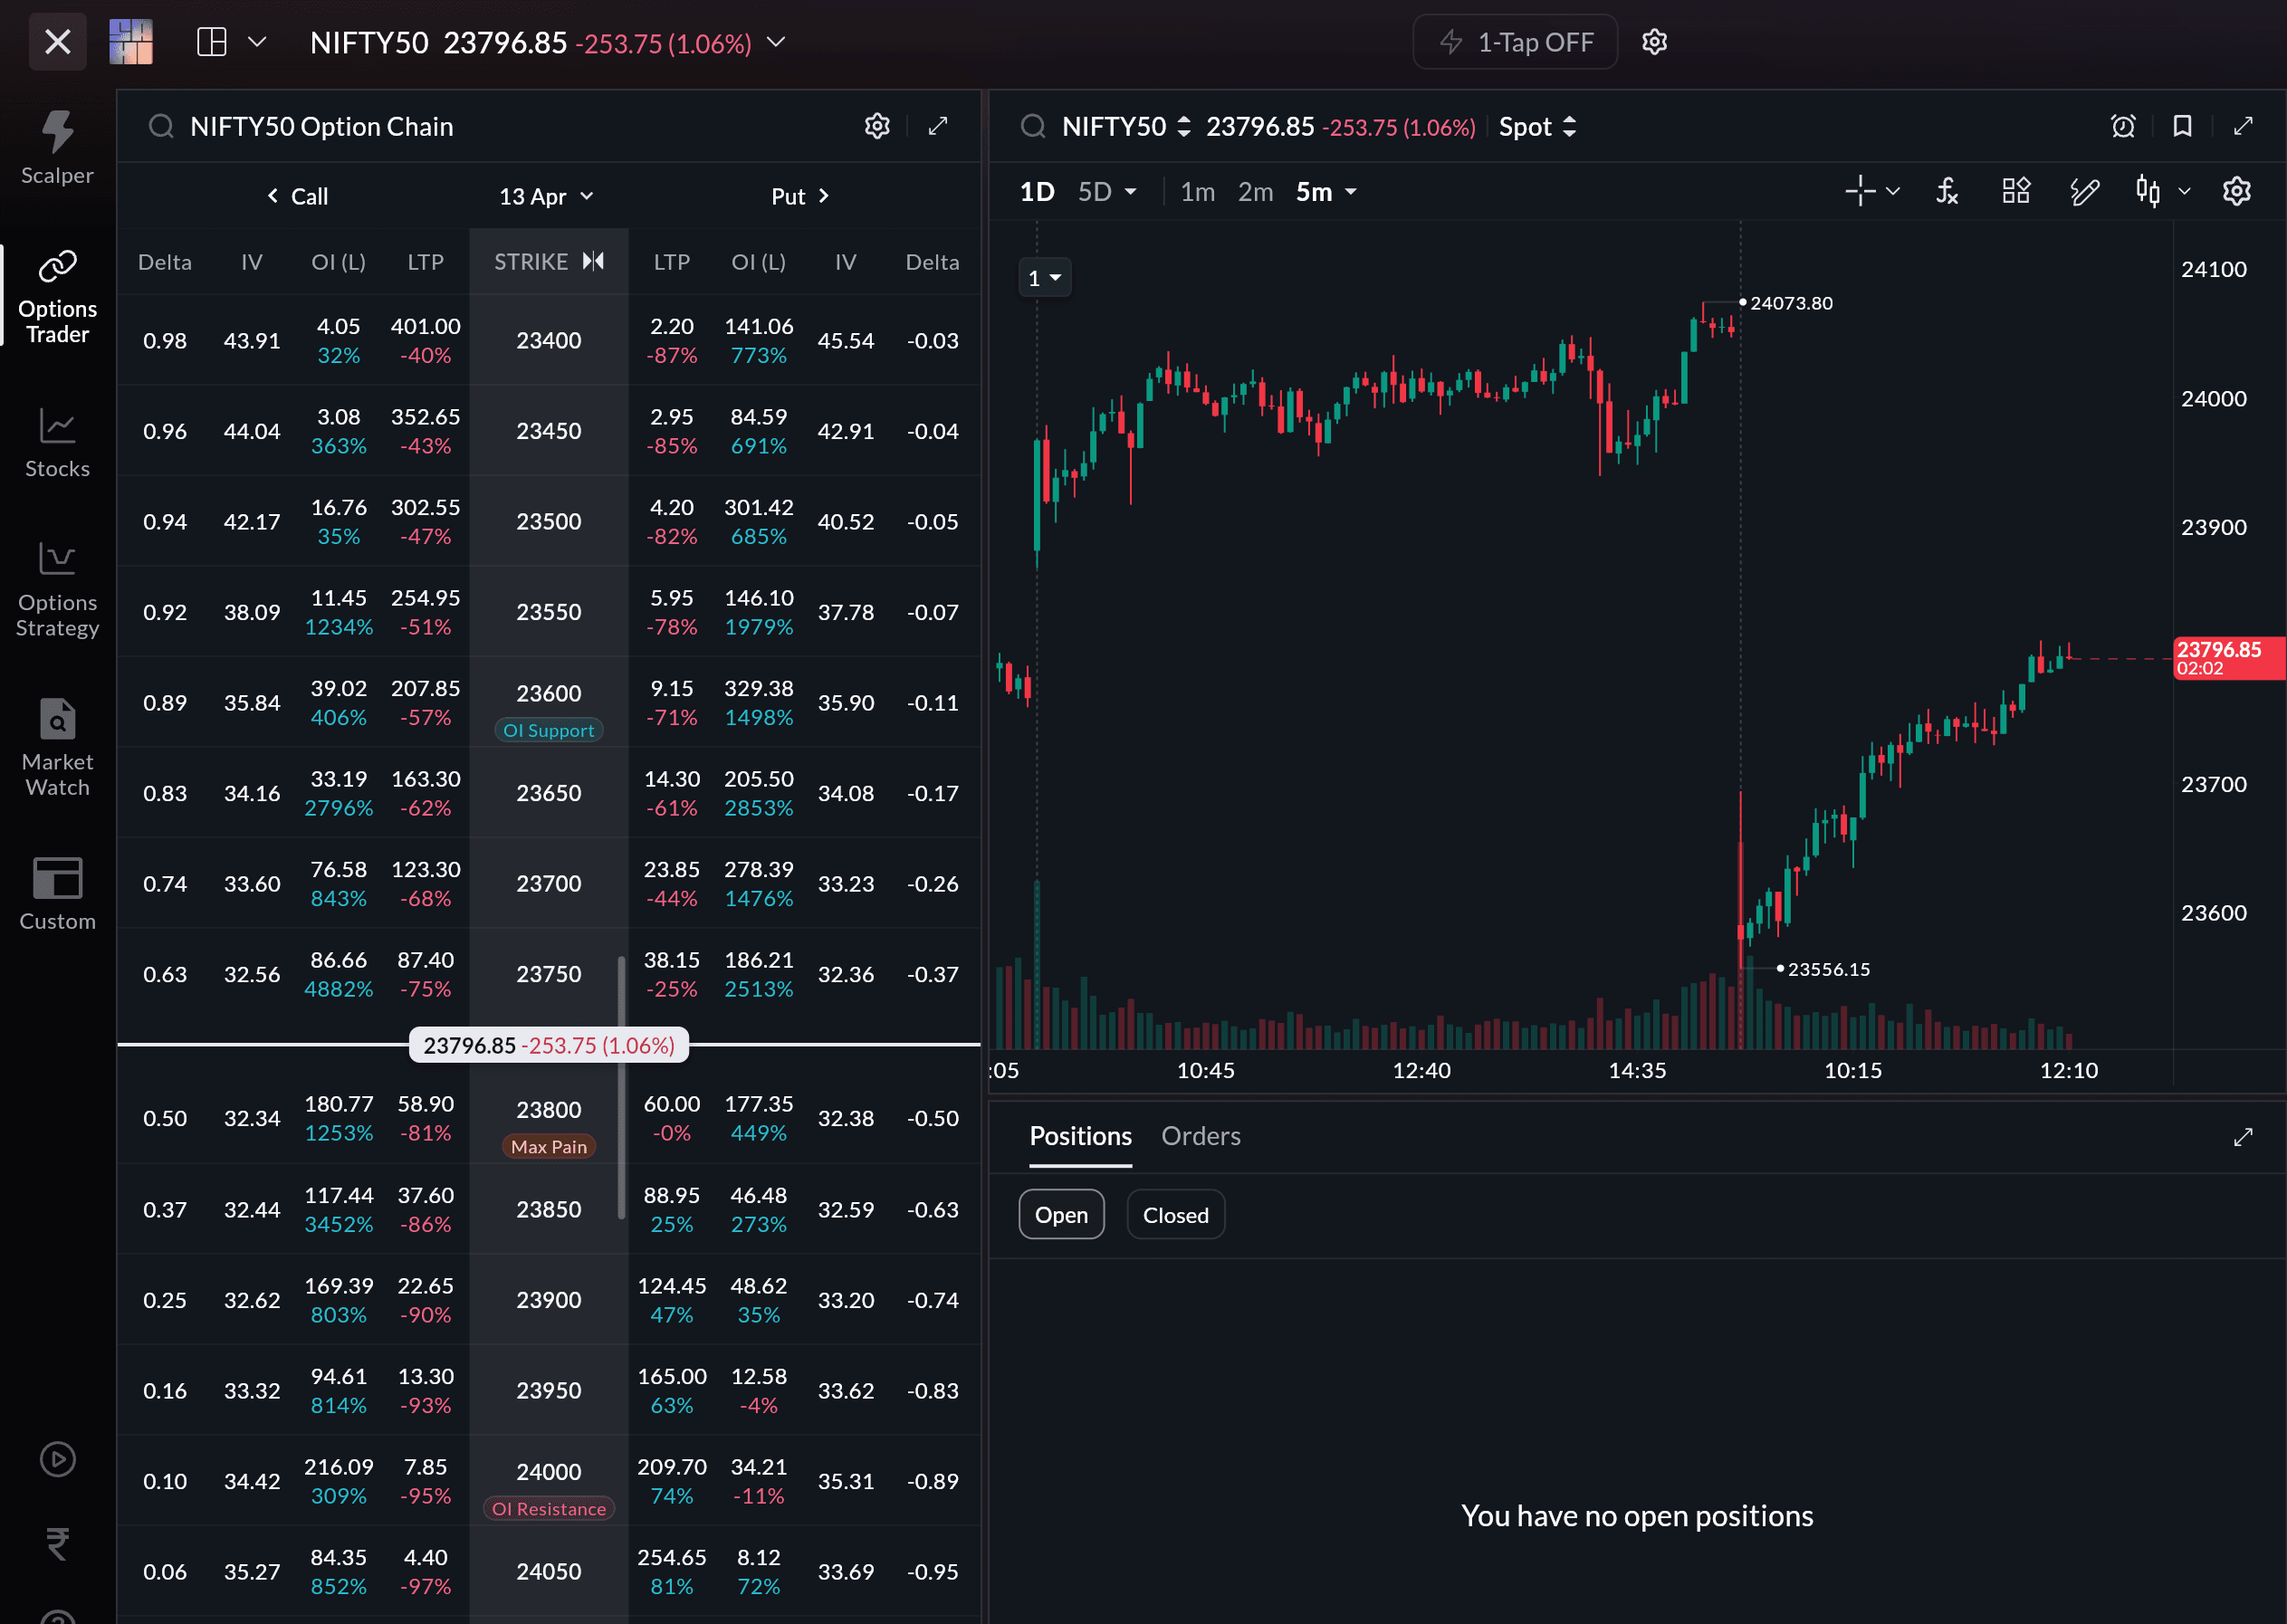
What Does Change in Open Interest Mean?
Change in OI is the difference between the open interest for the current session and the previous one. By observing this change alongside price movement, traders can assess whether fresh positions are being built or existing ones are being wound down — and whether the market is gaining or losing conviction.
The table below shows the four core combinations of price and OI movement and what each typically signals:
| Price | Open Interest | Signal | Market Sentiment |
|---|---|---|---|
| Rising | Increasing | Long Build-up | Bullish — strong, fresh buying |
| Falling | Increasing | Short Build-up | Bearish — fresh selling pressure |
| Rising | Decreasing | Short Covering | Bullish — but temporary, not conviction-driven |
| Falling | Decreasing | Long Liquidation | Bearish — but weakening, positions being exited |
This framework is most useful when used alongside volume data and broader price context — not in isolation.
Interpreting Open Interest Changes
Increasing OI
Rising OI means new contracts are being created — more participants are opening positions. This indicates increased market engagement and generally suggests the current price trend has fresh participation behind it. When prices are rising alongside OI, it implies new buyers are entering, strengthening the uptrend. When prices are falling alongside rising OI, it signals new short positions are being built — a bearish sign with conviction.
You can add a OI filter on option charts on SAHI seamlessly.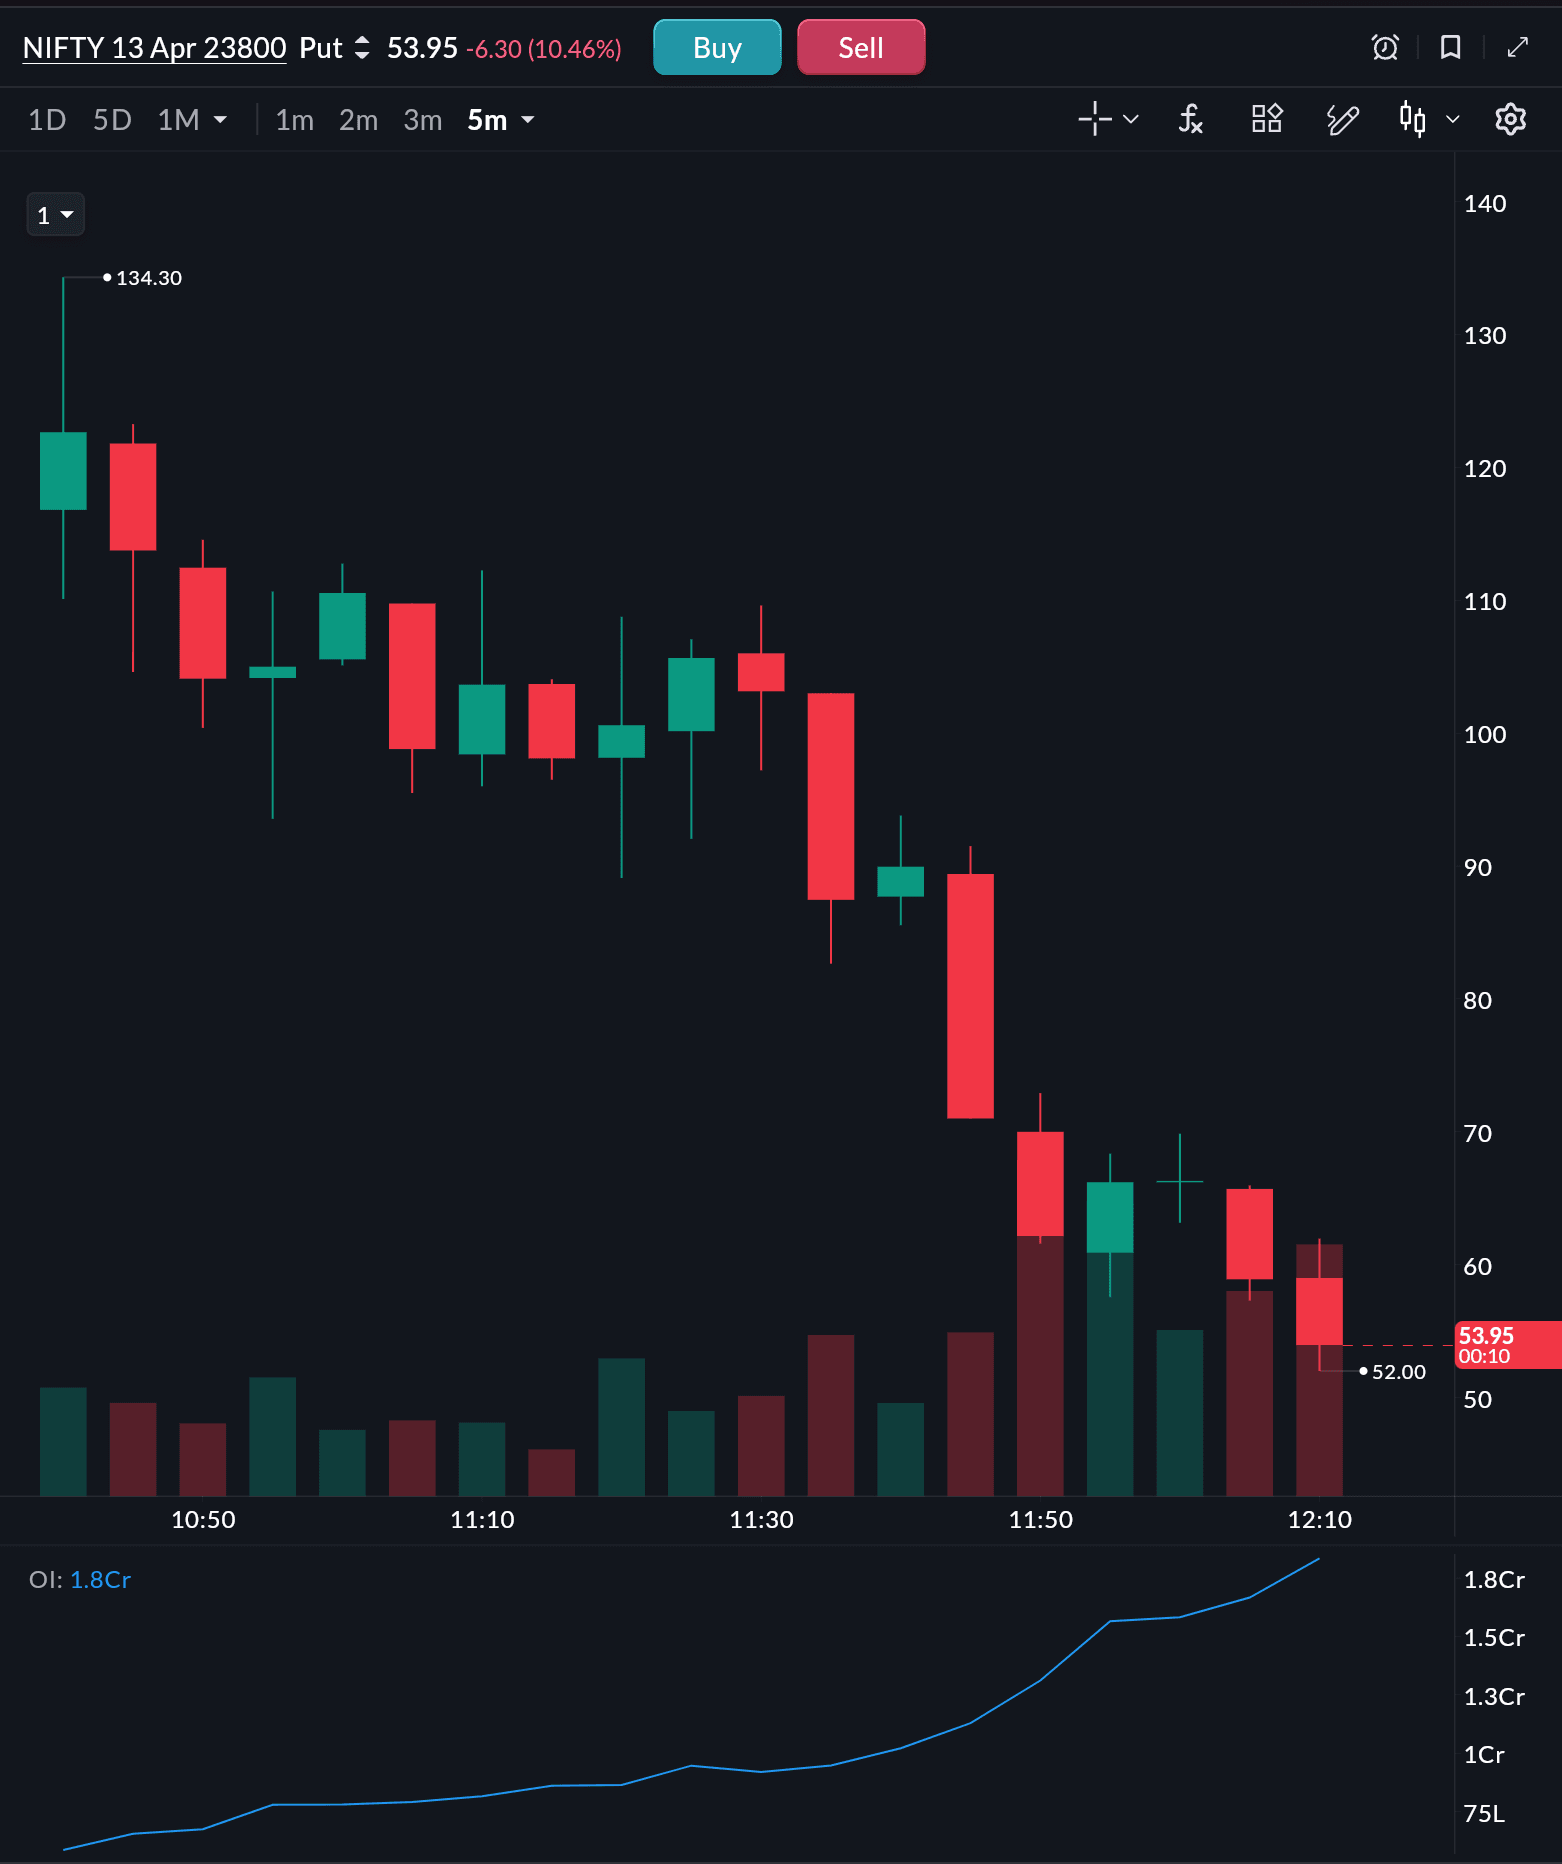
Rising OI by itself does not tell you who is in control — buyers or sellers. It only tells you that more participants have committed to a view. For directional clarity, you need the price context from the table above. Rising OI also typically correlates with improved liquidity, tighter bid-ask spreads, and deeper order books around that strike or contract.
Decreasing OI
Falling OI means participants are closing positions. The market is unwinding rather than building. When prices fall alongside declining OI, it suggests longs are exiting — long liquidation — which can indicate weakening conviction in a prior uptrend. When prices rise alongside declining OI, it signals short covering rather than fresh buying — a less durable rally.
A significant OI contraction after an extended move often precedes consolidation or reversal, as the market has run out of fresh fuel.
Benefits of Using Open Interest
Market Sentiment
OI helps traders identify whether a price move is backed by real participation or is simply the result of thin-volume noise. A sustained trend with rising OI and volume has more credibility than the same price move on declining OI. Reading the option chain alongside OI gives you a fuller picture of where institutional positioning is concentrated at specific strikes.
Trend Confirmation
OI acts as a secondary lens to verify price trends. During uptrends, price increases with rising OI and healthy volume confirm that fresh capital is entering and the trend has durability. Price increases on flat or declining OI may reflect short covering or profit-taking — moves with weaker follow-through. During downtrends, price declines with rising OI indicate persistent selling conviction. Aligning OI cues with VWAP, ADX, and moving averages strengthens their reliability.
Reversal Indicators
Watch for situations where price makes marginal new highs while OI stalls or declines — this often signals that longs are exiting rather than adding, which can precede a reversal. A sharp OI contraction at a key strike or a sudden flip in dominant OI levels can also signal a turn is approaching. These are not definitive signals on their own, but they raise the alert level for a potential change in direction.
Liquidity Tracking
High OI concentrations at specific strikes deepen order books and reduce slippage on entry and exit. Low OI zones create wider spreads and incomplete fills. As a general rule, prioritise strikes in the top decile of volume and OI — usually at-the-money and near-the-money strikes close to weekly expiries — for tighter execution and more reliable signals.
How to Use Open Interest to Trade on NSE
Traders on NSE combine OI data with price action to assess market direction. The key principle is: never read OI in isolation. A rising price with rising OI is more credible than a rising price on declining OI. A falling price with rising OI is a stronger bearish signal than falling price with falling OI.
OI divergences — where price moves in one direction but OI moves contrary to what the trend would suggest — are particularly useful. For example, if Nifty makes a new high but OI is declining, it may indicate that the rally is being driven by short covering rather than fresh buying, making the move less sustainable. Understanding the difference between Nifty and Sensex derivatives helps frame where OI analysis is most actionable — Nifty's deeper liquidity makes its OI signals more meaningful than most other indices.
OI is also useful for identifying support and resistance. Heavy put OI at a strike below the market often acts as a support floor — option writers defend it. Heavy call OI above the market can act as a ceiling. These levels shift as OI rolls between strikes over the course of a week. If you are new to F&O concepts, understanding how options pricing and position mechanics work will make OI data significantly more useful in your analysis.
How to Trade OI With SAHI
To use OI analysis on SAHI, log in to the platform via mobile or desktop and follow the steps below:
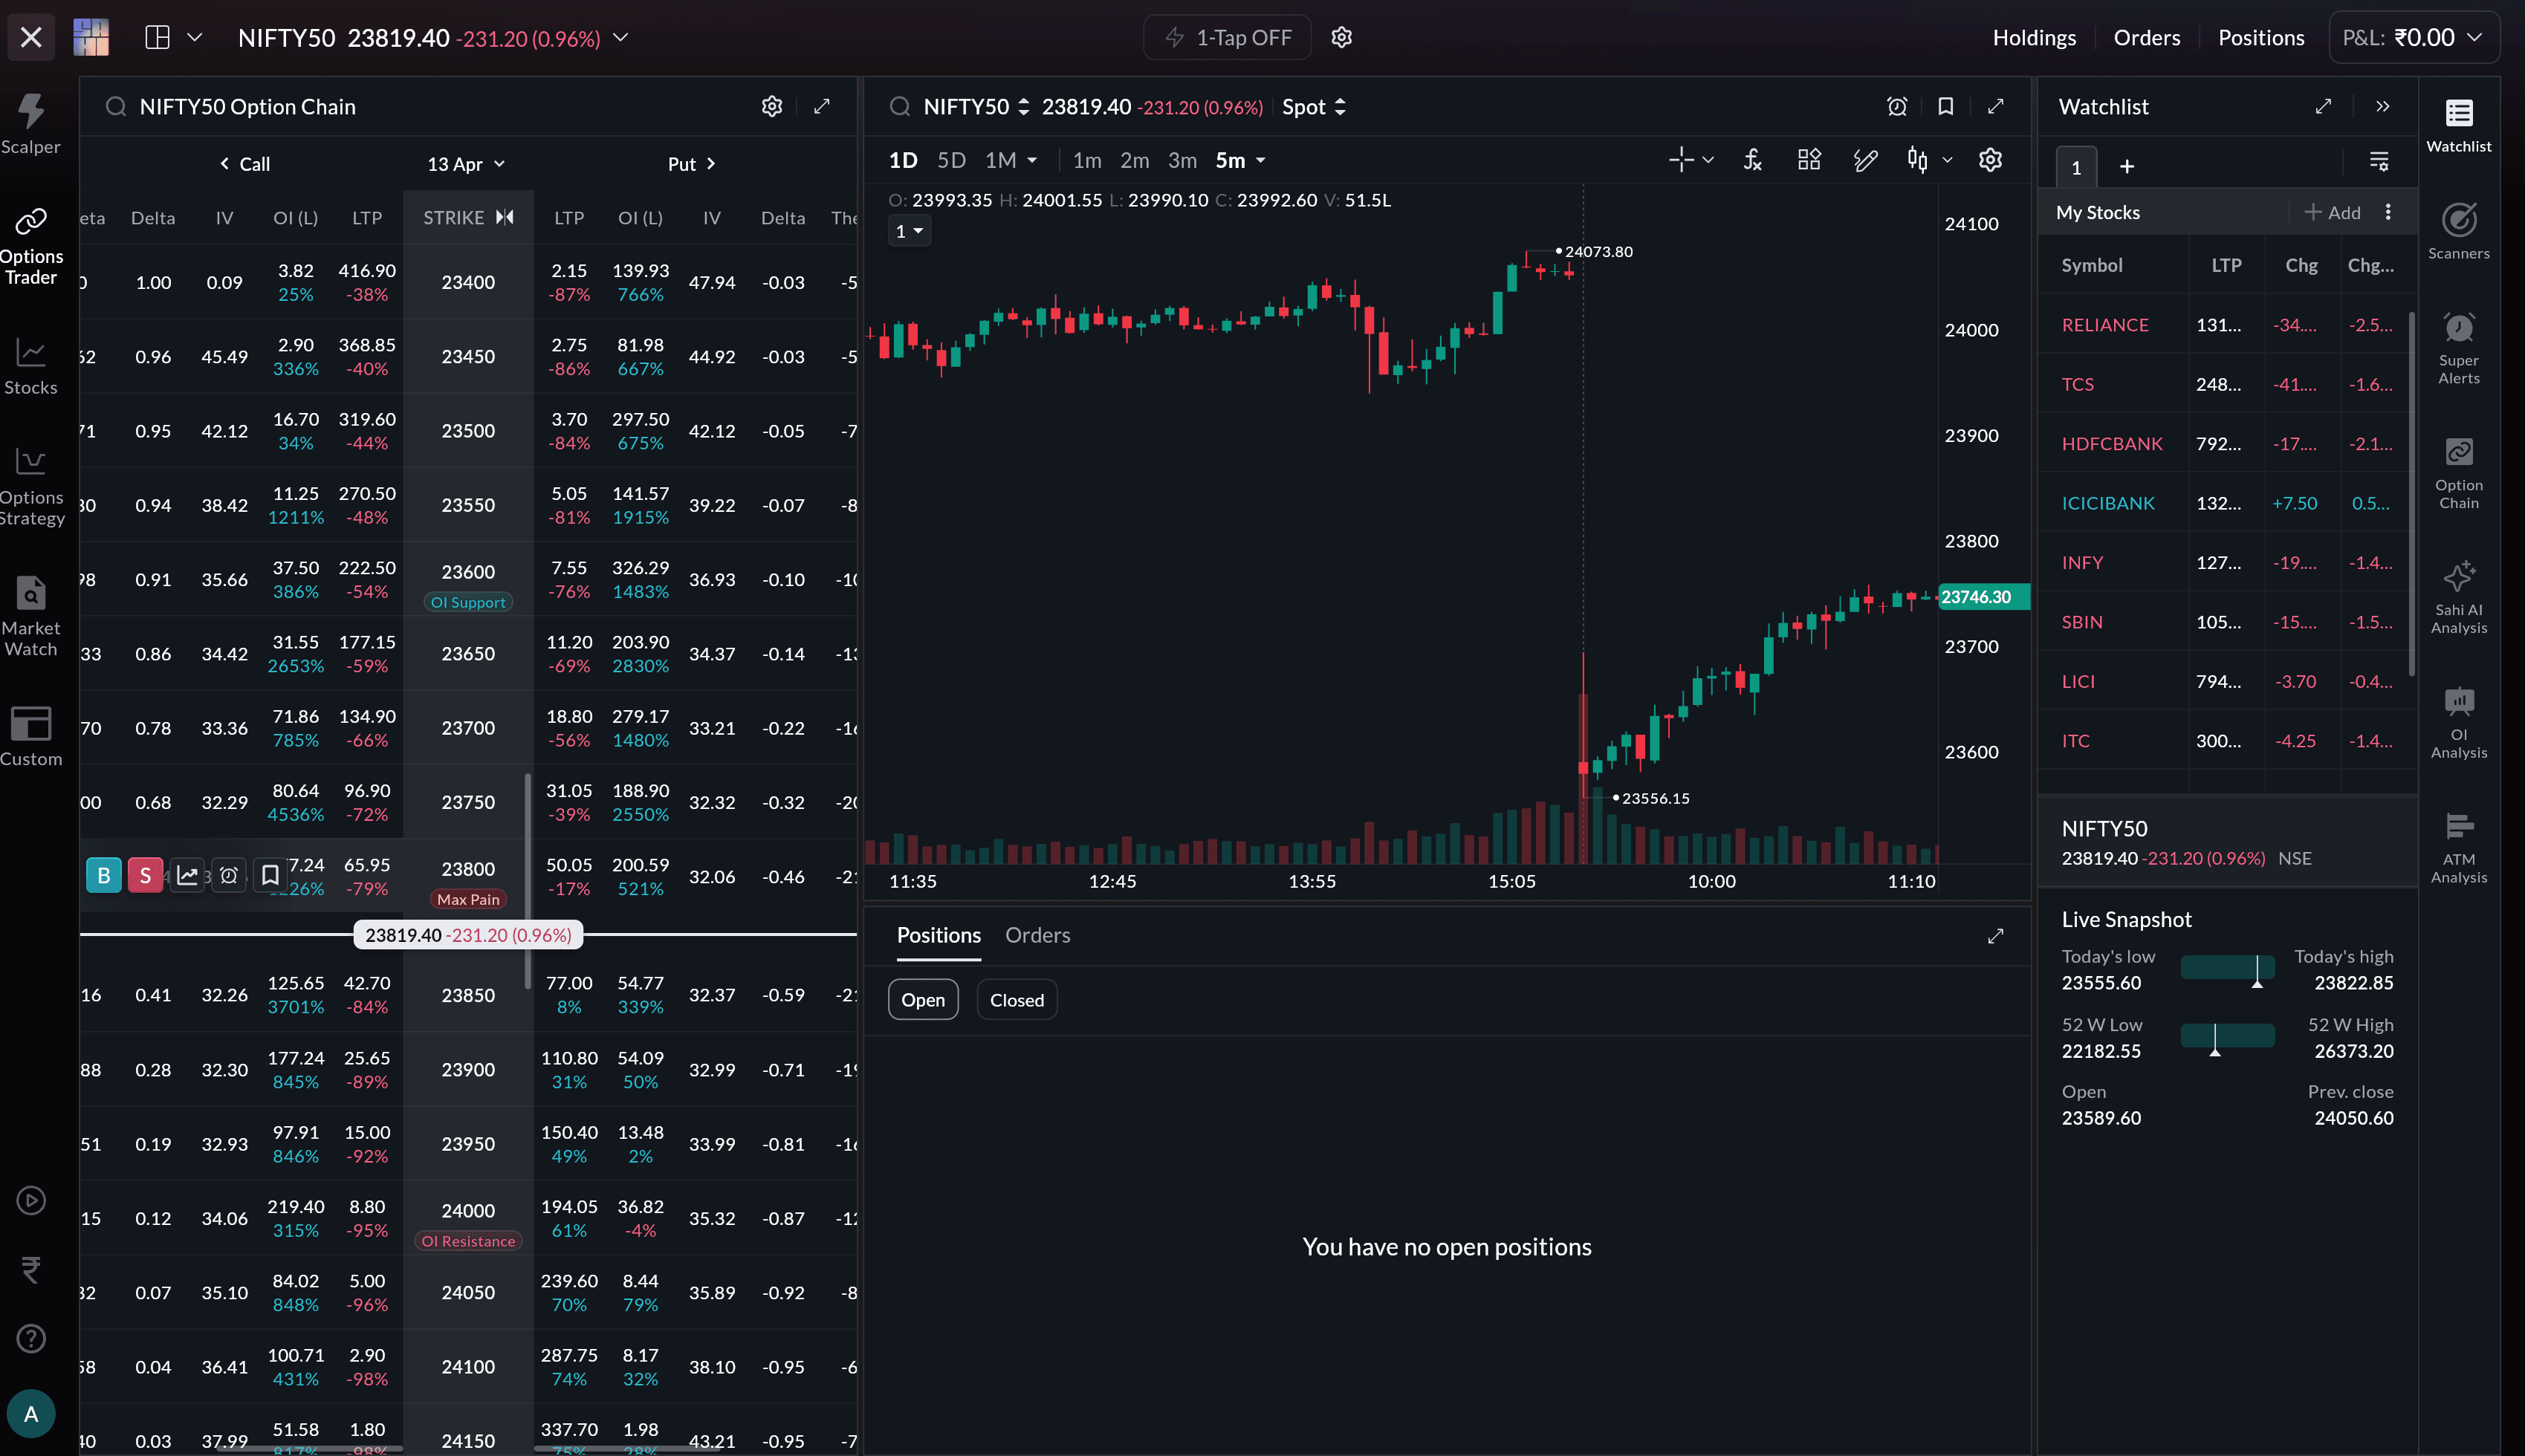
- Click on the 'OI Analysis' section on the right side of the window and select NIFTY 50 as your preferred index. You will see the open interest and the change in OI for each strike.
- Tap any strike price to see its call and put options. Choose 'Buy' if you want a long position and 'Sell' if you want to go short.
- Use the OI table to inform your direction. Rising price with increasing OI suggests a long build-up; falling price with rising OI suggests a short build-up. Use these as inputs — not automatic triggers.
- Fill in the order details: order type, quantity, and price.
- Review the margin requirement and total cost before placing the 'Buy' or 'Sell' order.
- Track your positions from the 'Positions' tab.
You can also use SAHI's Scalper 2.0 platform for OI analysis alongside other indicators on a single screen — including ATM analysis and AI-based insights.
Final Thought
Open interest is one of the most practical tools available to F&O traders. Used correctly, in combination with price action, volume, and the broader option chain, it tells you whether a move has real participation behind it, where conviction is building or fading, and which price levels the market is defending. Rising OI means new positions are being created; falling OI means they are being closed. Neither is inherently bullish or bearish, direction depends entirely on what price is doing at the same time.
For Indian traders active in Nifty options, OI data is publicly available on NSE's option chain page and updated in real time throughout the trading session. Incorporating it into your analysis does not require complex tools — it requires understanding what the numbers mean and why they move.
Disclaimer: This article is for informational and educational purposes only and does not constitute investment advice or a recommendation to buy or sell any securities. F&O trading involves significant risk of loss. Please consult a SEBI-registered financial advisor before making any investment or trading decisions. SAHI is not responsible for any trading decisions made based on this content.