
Nifty 50 vs Sensex: What's the Difference and Which Should F&O Traders Track?
Both indices track the same market — but for F&O traders, only one of them actually matters.
Every trading day in India starts the same way. Your phone lights up. News channels flash red or green. The chyron reads something like: "Sensex falls 600 points. Nifty below 22,000."
You've seen it hundreds of times. Most people just accept that the Nifty 50 and Sensex are basically the same thing and move on. For casual investors, that's fine. For F&O traders, it's a problem, because one of these indices has nothing to do with your trades, and one of them is the whole game.
Let's get into it.
A short history lesson
The Sensex
The Sensex, short for sensitive index, was launched by the Bombay Stock Exchange on January 1, 1986. It tracks 30 of the largest, most liquid companies on the BSE.
Its base year is 1978–79, with a base value of 100 set from April 1, 1979. When the index was first published on January 1, 1986, it stood at 549 — already nearly 5.5x the base. Today it trades above 75,000. Before the Sensex, there was no reliable number for "the Indian market." People tracked a handful of stocks and took their best guess.
The Nifty 50
The Nifty 50 came about a decade later. Its base date is November 3, 1995, with a base value of 1,000, but it was officially launched and first published on April 22, 1996. It covers 50 companies across 13 sectors.
NSE was built as a fully electronic exchange from day one — no trading floors, no shouting. That made it faster, more auditable, and harder to manipulate. Derivatives trading gravitated there almost immediately after the F&O segment opened in 2000.
Today NSE is the world's largest derivatives exchange by contract volume. It's held that title for at least seven consecutive years. That's the context for why this comparison matters.
The numbers, compared
| Feature | Sensex | Nifty 50 |
|---|---|---|
| Exchange | BSE | NSE |
| Stocks tracked | 30 | 50 |
| Launched | 1986 | 1995 |
| Base value | 100 (base year 1978–79) | 1,000 (base date Nov 3, 1995) |
| Weighting method | Free-float market cap | Free-float market cap |
| Dominant sector | Financial Services | Financial Services |
| F&O lot size (2026) | 20 | 65 |
| Weekly expiry day | Thursday (BSE) | Tuesday (NSE) |
| F&O liquidity | Growing, but much lower | Dominant — deepest in India |
Nifty 50 sector breakdown (Source: NSE Indexogram, February 27, 2026)
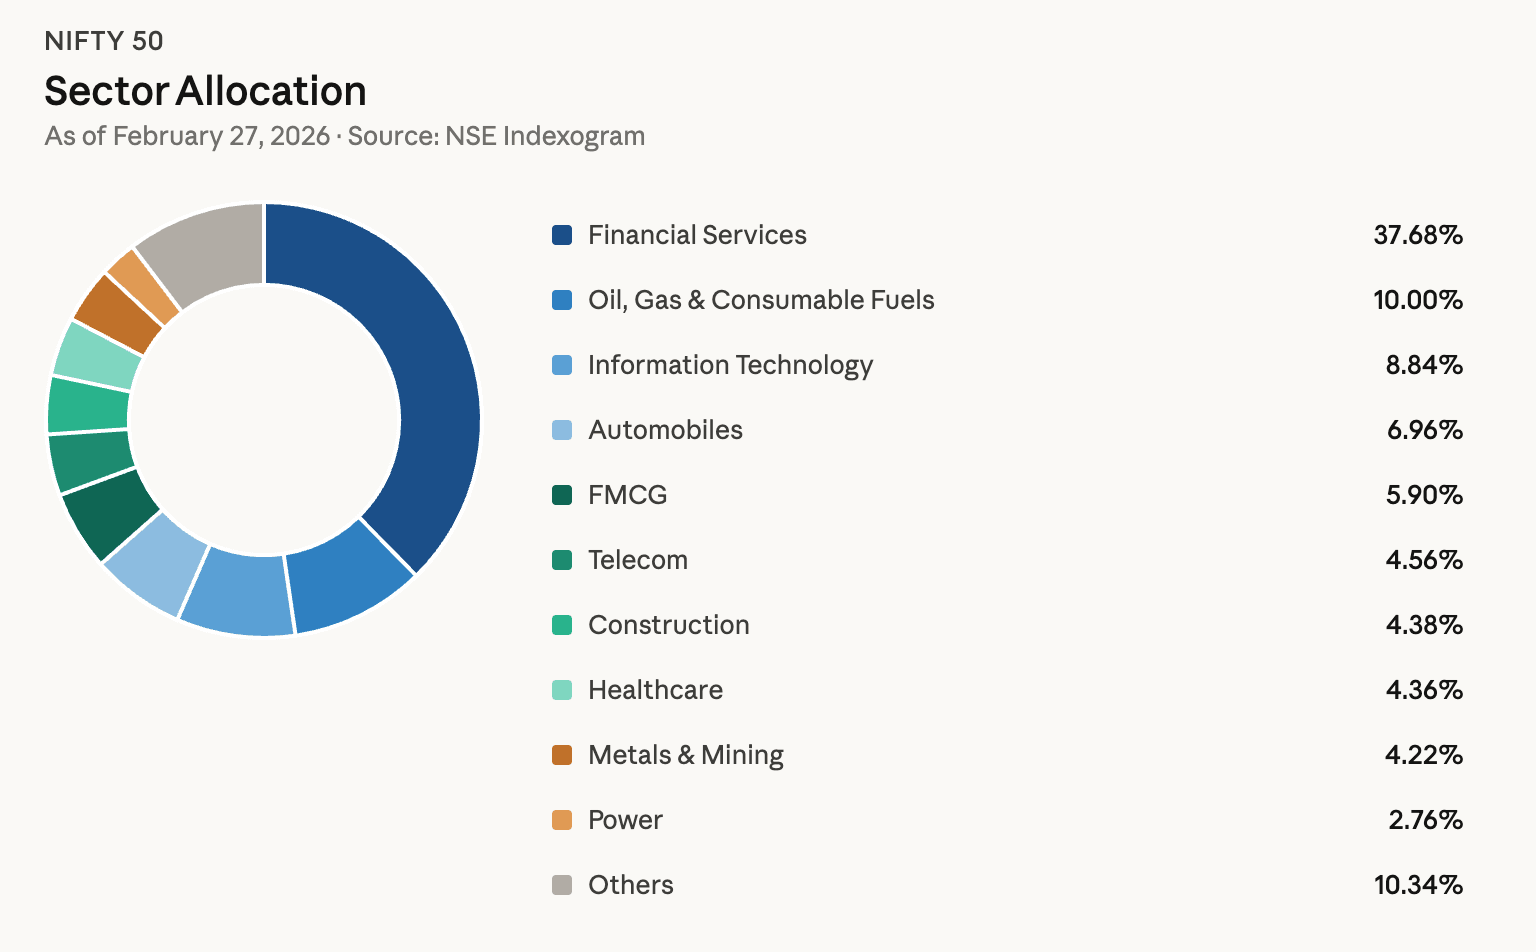
Top 10 Nifty 50 stocks by weight (NSE Indexogram, February 27, 2026):
- HDFC Bank Ltd. — 11.83%
- ICICI Bank Ltd. — 8.58%
- Reliance Industries Ltd. — 8.20%
- Bharti Airtel Ltd. — 4.56%
- Larsen & Toubro Ltd. — 4.38%
- State Bank of India — 4.34%
- Infosys Ltd. — 3.97%
- Axis Bank Ltd. — 3.46%
- Kotak Mahindra Bank Ltd. — 2.66%
- Mahindra & Mahindra Ltd. — 2.64%
Sensex: same companies, higher concentration
The Sensex holds similar companies — but with only 30 of them, the top names weigh more heavily. HDFC Bank is the top stock in Nifty 50 at 11.83% and carries 7.92% in the Sensex. Reliance is 8.20% in the Nifty vs. 12.84% in the Sensex, illustrating how the 30-stock concentration amplifies single-name exposure.
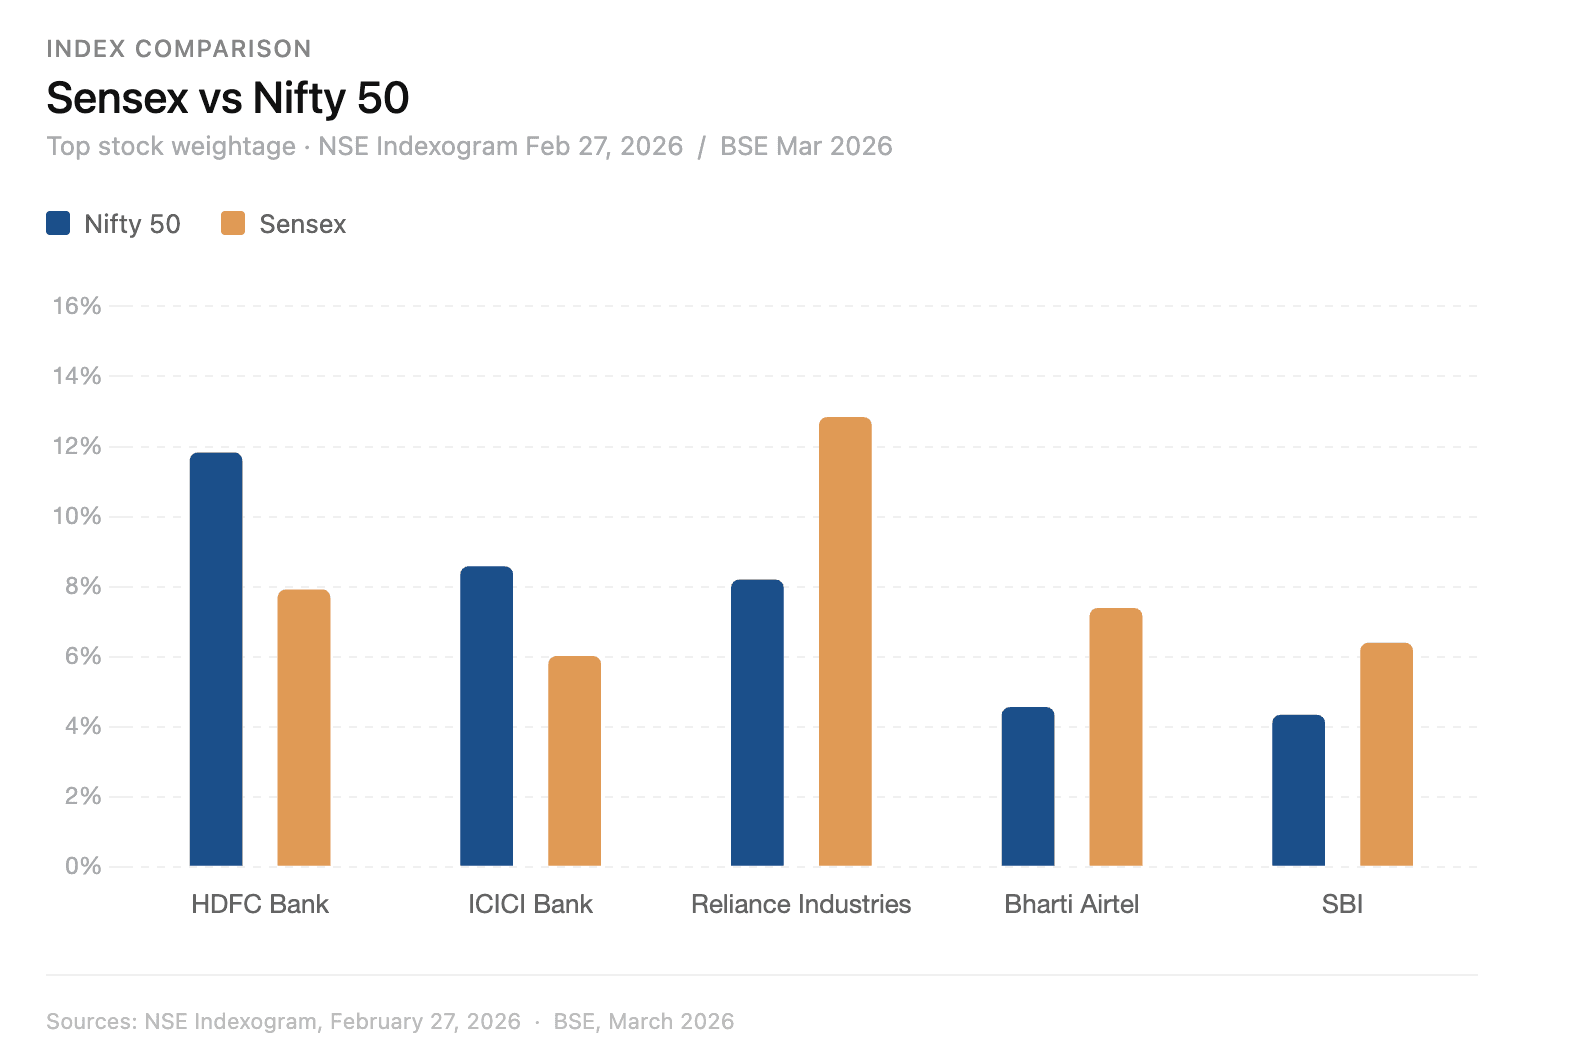
In practice: when HDFC Bank (11.83% of Nifty, 7.92% of Sensex) or Reliance (8.20% of Nifty, 12.84% of Sensex) reports a bad quarter, the index with fewer stocks takes the harder knock. With only 30 names, the Sensex is more sensitive to any single company's move.
Do they actually move differently?
Mostly no. Their correlation is approximately 0.99, which means they are, for most practical purposes, the same line on a chart. Nifty up 1.2%, Sensex up 1.1–1.3%. That's why the financial media quotes them interchangeably.
The exceptions are worth knowing about. On high-volatility days, when a major index constituent makes a sharp, sudden move, the Sensex can diverge from Nifty by a few hundred points intraday. In March 2026, with India VIX climbing to its highest level since June 2024, these gaps have shown up more than usual.
For F&O traders, the risk is this: if you're watching Sensex levels on TV while your position is on Nifty, a 50–100 point discrepancy can be confusing at exactly the wrong moment.
What F&O traders need to know
The short answer: if you're trading F&O in India, you're almost certainly trading Nifty. And you should be.
All the liquidity is on NSE
India's derivatives market runs on NSE. Nifty 50, Bank Nifty, Nifty IT, Nifty Midcap Select — the volume and market depth are all there. BSE has been running Sensex F&O, and it's been gaining ground in 2025–26, but it's still significantly less liquid than Nifty.
For retail traders, spread size isn't a small thing. A wider bid-ask spread means you're losing a bit every time you enter or exit, before you've paid any brokerage. Over dozens of trades, that adds up.
The expiry calendar runs on Thursday
Nifty expires every Tuesday on NSE. Sensex expires on Thursdays on BSE.
Tuesday expiry has become the clock that the Indian F&O market runs on. Pre-expiry volatility, gamma risk, the morning OI build — it all centers on Tuesdays. NSE moved its weekly expiry from Thursday to Tuesday in September 2025 (simultaneously, BSE moved Sensex expiry to Thursday). Almost every retail strategy is now oriented around this Tuesday calendar.
50 stocks gives you cleaner macro exposure
If you're trading a broad market view, "the market should recover in April" or "FIIs are rotating back in", Nifty gives you cleaner exposure than Sensex does. With 50 stocks, no single company's earnings call or governance issue can distort the index much. With 30, it can.
The options chain carries real information
The Nifty options chain is one of the more useful tools available to a retail trader. Heavy call OI at a strike tends to act as resistance. Heavy put OI tends to act as support. Watching how OI shifts across strikes in real time gives you a read on where institutional money is positioned before price gets there.
This dynamic doesn't work as well with Sensex options. The liquidity isn't deep enough for OI positioning to be as meaningful.
When Sensex still matters
This isn't a case against the Sensex; it's useful in specific contexts.
If you hold equity mutual funds, your fund almost certainly benchmarks against the Sensex. Your outperformance or underperformance is measured against that number, not Nifty.
International media and global investors default to Sensex when they talk about India. When Bloomberg says Indian markets hit a record, they mean the Sensex. That's just convention, but it's worth knowing which number they're using.
A handful of companies list exclusively on BSE. If you ever trade one of those, BSE and Sensex context are more relevant.
Which index to track
For F&O trading: Nifty. Your strikes, your expiry, your Greeks, your OI data — none of it is Sensex. Watching Sensex levels while trading Nifty options is like tracking a different game.
For your equity portfolio: both, but the Sensex is the benchmark your funds are actually judged on.
For sector trades, go deeper than either. Bank Nifty, Nifty IT, Nifty Auto, and F&O concentration in India is largely in these sector indices.
Trading Nifty on SAHI
SAHI is built for retail F&O traders who want to trade Nifty without the interface overhead that most platforms pile on. Live OI data, position Greeks, and market depth in one place.
If you're newer to Nifty F&O, SAHI also has a guide on the lot size changes for Nifty and Sensex derivatives that took effect in late 2025 — useful context before you start sizing positions.
Start trading Nifty F&O on SAHI →
The bottom line
The Sensex and Nifty 50 move together on most days and measure the same broad market. The Sensex is older, covers 30 stocks, and is the index the rest of the world associates with India. The Nifty 50 covers 50 stocks and is the foundation of India's entire derivatives market.
For daily news consumption, either index works.
For trading options, it's Nifty. There isn't really a debate.
Disclaimer: This article is for informational and educational purposes only. It does not constitute financial advice, investment advice, or a recommendation to buy or sell any financial instrument. Trading in F&O (Futures & Options) involves significant risk and is not suitable for all investors. Readers should verify current data independently before making any trading decisions.