
EMA Scalping Strategy: The 9/21 Crossover Setup for Nifty & Bank Nifty
Part of Sahi's Complete Scalping Guide for Indian Traders
They slap a 9 and 21 EMA on a daily chart, wait for a crossover, and enter a swing trade. That works, but it is not scalping. Scalping with EMAs is a different discipline entirely. It demands that you understand why the crossover matters, when it lies to you, and exactly how to execute an entry with a pre-defined stop before the candle closes.
This article is for traders who want to use the 9/21 EMA crossover as a primary scalping strategy on Nifty and Bank Nifty. We cover the exact setup, entry trigger, stop-loss logic, target levels, and the filters that separate high-probability trades from noise. Everything here is battle-tested on Indian index derivatives, specifically Nifty 50 and Bank Nifty on 1-min and 3-min charts.
Why EMAs Work for Scalping, The Actual Reason
The Exponential Moving Average gives more weight to recent price action than the Simple Moving Average. The 9 EMA responds almost instantly to price movement. The 21 EMA is slower, acting as a short-term mean.
When these two lines cross, what you are seeing is this: short-term momentum has shifted relative to the medium-term directional bias. In a scalping context on a 1-min or 3-min chart, this shift is often the beginning of an 80–150 point move on Bank Nifty or a 25–50 point move on Nifty.
That is your target.
The reason traders fail with EMA crossovers is that they treat every crossover as a signal. During choppy, sideways markets — which happen roughly 60–70% of the time in Indian indices — the 9 and 21 EMA chop back and forth and generate false signals continuously. The skill is not in identifying the crossover. It is in identifying which crossovers to trade.
Chart Setup: Getting Your Workspace Right
Before discussing entries, get your chart set up correctly.
Timeframes: 3-min primary chart, 15-min for higher-timeframe context
Indicators to add on Sahi Charts:
- 9 EMA — set to a bright colour like orange
- 21 EMA — set to white or light blue (or anything else, as per your mood)
- Volume bars — visible on the same pane
- VWAP — as an optional anchor level for intraday bias

What you are looking for structurally before any trade:
On the 15-min chart, first identify: is price trending or ranging? If it has been oscillating within a 50-point range on Nifty for the last 4–5 candles, 3-min crossovers will be mostly noise. If you see a clear staircase structure — higher highs and higher lows, or lower highs and lower lows — crossovers in the direction of that trend are tradeable.
This is the single most important filter in EMA scalping. Trade crossovers in the direction of the higher-timeframe trend.
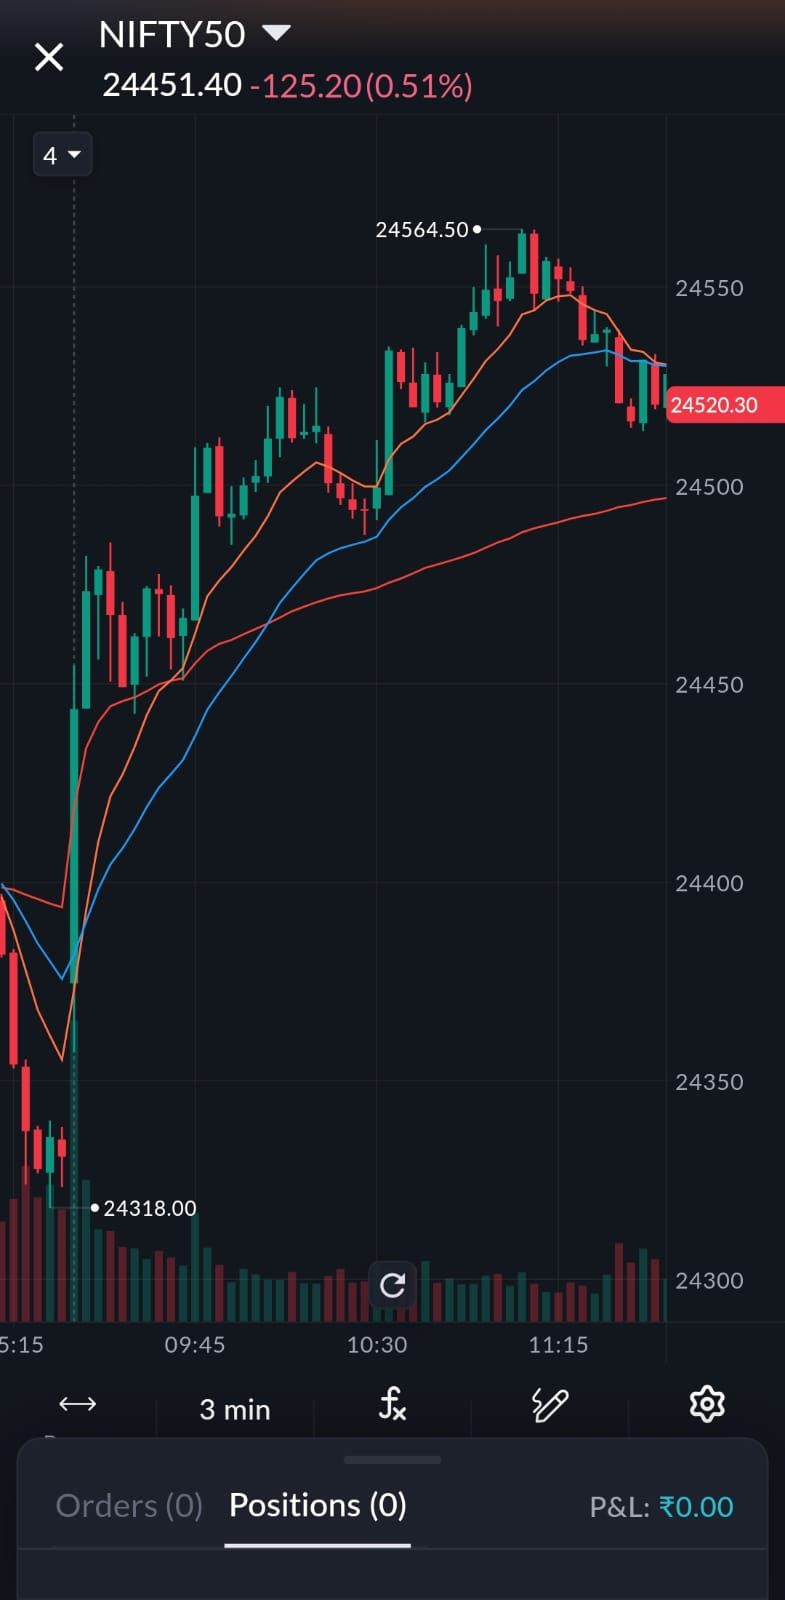
The Core Setup: 9/21 EMA Crossover on 3-Min
Here is the exact setup written as a simple rule-set.
Bullish Crossover (Long Trade)
- On the 15-min chart, price is in an uptrend — making higher highs and higher lows, or trading above VWAP with a clear directional push.
- Drop to the 3-min chart. The 9 EMA, which was below the 21 EMA, now crosses above it.
- The crossover candle is a green candle (or at minimum a doji that closed above open).
- Volume on the crossover candle is higher than the preceding 3–4 candles. This confirms conviction behind the move.
- Price is above VWAP or at least not deeply below it.
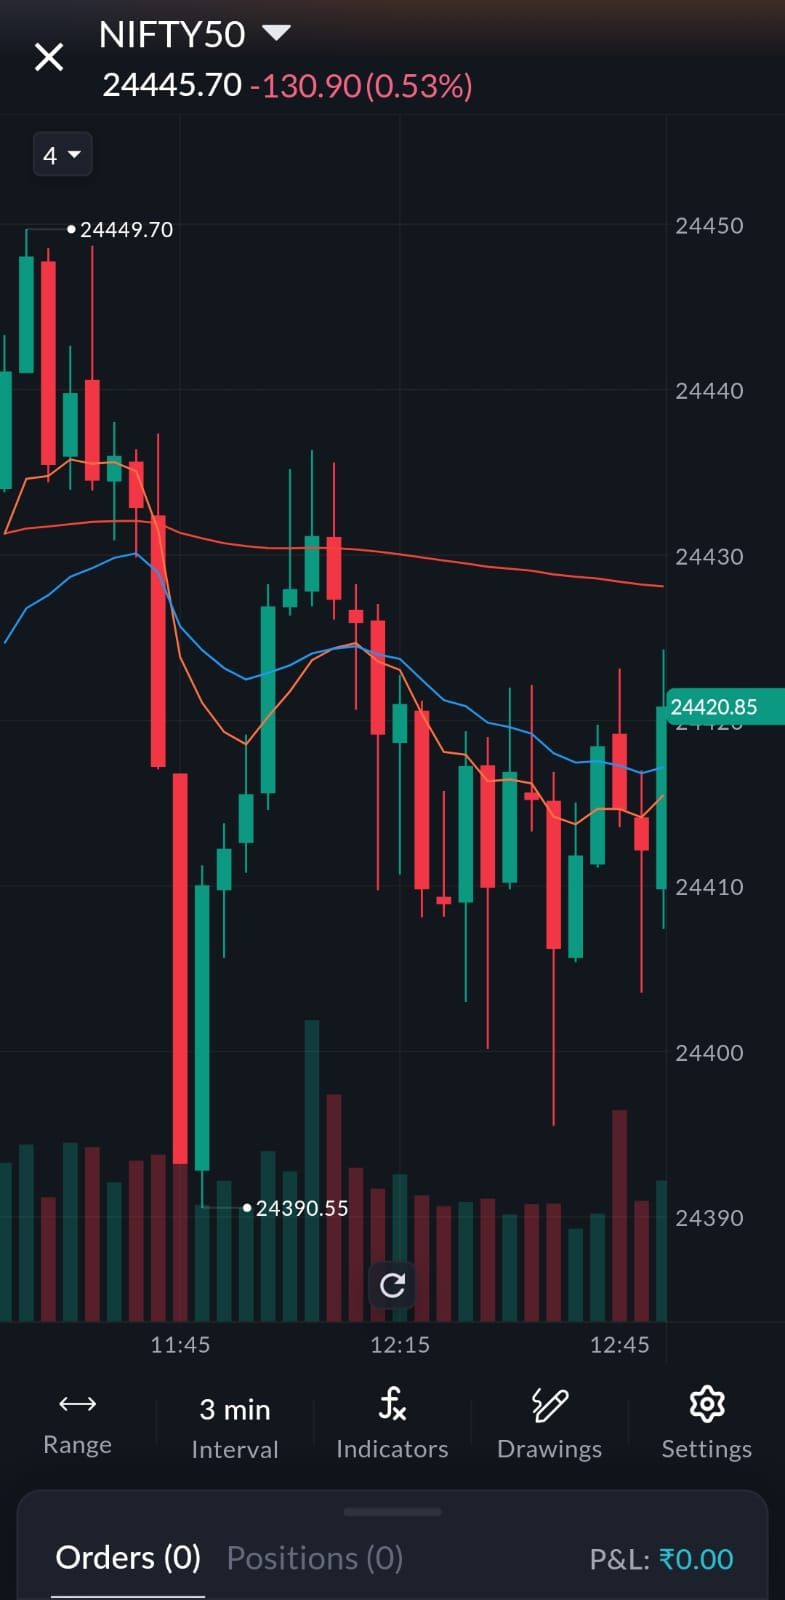
Bearish Crossover (Short Trade)
- On the 15-min chart, price is in a downtrend — making lower highs and lower lows, or trading below VWAP.
- Drop to the 3-min chart. The 9 EMA, which was above the 21 EMA, now crosses below it.
- The crossover candle is a red candle.
- Volume is elevated on the crossover candle.
- Price is below VWAP.
Entry Rules — Exactly When to Pull the Trigger
There are two valid entry approaches. Choose one and stick with it consistently.
Entry Method 1: At Candle Close (Conservative)
Wait for the 3-min crossover candle to close fully. Enter at the close price. This means you will miss the first few points but you have confirmation that the candle actually closed in your direction. This is the method recommended for traders who have been burned by late-reversing candles.
Entry Method 2: At Break of Crossover Candle High (Aggressive)
Place a buy-stop order at the high of the crossover candle while it is still forming. If the candle's high is breached in the same timeframe, you get a better entry. If it is not, the candle closes and you reassess. This method gives you a slightly better entry but has a higher false trigger rate.
For Nifty scalping, Method 2 often gives better risk-reward because the index moves fast. For Nifty (which moves more slowly), Method 1 is cleaner.
Stop-Loss Placement — The Rule That Protects Your Capital
Stop-loss in EMA scalping is non-negotiable. Here is the exact rule:
For a long trade: Place your stop-loss at the low of the crossover candle. If that candle had a particularly wide range (more than 60–70 points on Bank Nifty), use the low of the previous candle instead. Never risk more than 0.5% of your capital on a single scalp trade.
For a short trade: Place your stop-loss at the high of the crossover candle, or the high of the preceding candle if the range was wide.
This placement is logical: if the EMA crossover was genuine, price should not come back through the entire body of the candle that created the signal. If it does, the signal was false and you exit immediately — no questions asked, no hoping.
Target Setting — How Far to Let Winners Run
EMA scalping targets are based on a fixed risk-reward ratio plus key structural levels. Here is how to combine both:
Method 1: Fixed R:R Targets
- Target 1 (T1): 1.5× your initial risk (distance from entry to stop). Book 50% of your position here.
- Target 2 (T2): 2× to 3× your initial risk. Trail stop to entry for the remaining position.
Example: You enter Bank Nifty long at 48,500. Stop is at 48,440 (60-point risk). T1 = 48,590 (90-point gain). T2 = 48,620 (120-point gain). At T1, you sell 50% of your quantity and move stop to entry for the rest.
The 5 Filters That Dramatically Improve Win Rate
Raw crossover signals without filtering have a win rate of around 45–50%. With the following five filters, that improves to 60–68% in tested backtests on Bank Nifty data.
Filter 1: Higher-Timeframe Trend Alignment
Already covered above but worth repeating: only trade crossovers that align with the 15-min trend direction. Going against the higher-timeframe trend is the most common reason EMA scalps fail.
Filter 2: Volume Confirmation
The crossover candle must have noticeably higher volume than the three candles before it. In Sahi's charts, this is easy to spot — the volume bar on that candle should be clearly taller than its neighbours. Crossovers on declining or flat volume are suspect.
Filter 3: No Crossover Within 15 Minutes of 9:15 AM Open
The first 15 minutes of market open on Indian exchanges are extremely volatile. EMAs from the previous session have no carryover context, gaps are frequent, and the first few crossovers are almost always noise. Start looking for setups only after 9:30 AM.
Filter 4: No Trading Between 11:30 AM and 1:00 PM
This mid-session window on Indian markets is known for choppy, low-momentum price action. The institutional activity that drives clean trends is largely absent. EMA crossovers during this window have significantly lower follow-through. Many experienced scalpers simply take a break during these 90 minutes.
Filter 5: Price Distance from EMA
If price is far above the 21 EMA before a crossover occurs — more than 80–90 points on Bank Nifty — it means the crossover happened after a large portion of the move is already done. The risk-reward becomes unfavourable. The best crossover signals happen when the two EMAs are relatively close together and then cleanly diverge.
Common EMA Crossover Mistakes and How to Avoid Them
Mistake 1: Trading Every Crossover
Most crossovers are not worth trading. In a sideways day, the 9 and 21 EMA will cross 6–10 times and most of those trades will be small losers. Discipline means sitting on your hands and waiting for a setup that passes all your filters, even if that means no trades some days.
Mistake 2: Ignoring the Stop-Loss
If the market moves against you after entry, the stop is hit and you exit. Full stop. Traders who move their stop-loss further away after entry are not trading a strategy — they are gambling. The stop-loss is not negotiable because it is what makes the expected value of the strategy positive over 100 trades.
Mistake 3: Entering Too Late
Waiting for "one more confirmation" after the crossover candle closes often means entering when the move is already 30–40 points in. The risk-reward at that point is poor. Trust your filters, take the setup when it forms, and manage risk via position size.
Mistake 4: Over-leveraging
Scalping with excessive F&O positions because the stop is "only 60 points" is dangerous. Position size should be such that if the stop is hit, you lose no more than 0.3–0.5% of your capital.
Building a Trade Journal for EMA Crossover Scalping
A trade journal is what transforms this strategy from theory into a personalised, improving system. For every trade, log:
- Time of entry and exit
- Whether all five filters were met (yes/no for each)
- Entry price, stop-loss, and target levels
- Actual outcome — did the trade hit T1, T2, or the stop?
- Screenshot of the setup
After 50 trades, review which filter combinations produced the highest win rate for you. Different traders have different risk tolerances and execution speeds — your data will show you which setups to focus on.
For more on building habits that support consistent intraday trading, read: the importance of a trading journal here.
When This Strategy Does Not Work — And What to Do Instead
The 9/21 EMA crossover strategy performs worst on:
- Major Event days like RBI policy days and budget days: Volatility is event-driven rather than momentum-driven. EMAs lag events and provide misleading signals.
- Expiry days — Nifty's weekly Monday expiry and Bank Nifty's monthly Tuesday expiry (note: Bank Nifty weekly expiry contracts were discontinued in November 2024): Pin action near strikes creates artificial price movement that does not respect technical levels.
- Low-volatility days where Bank Nifty moves less than 200 points total: The crossovers simply do not have enough range to generate meaningful risk-reward.
On these days, either stay out entirely or reduce position size by 50%. There is no strategy that works in all market conditions — knowing when not to trade is itself a competitive advantage.
On high-volatility news-driven days, consider switching to an Opening Range Breakout strategy instead, which is better suited to large impulsive moves.