
Wipro Q4 FY26 Results: ₹35 Billion Profit, $1.44Bn Large Deal Bookings & ₹15,000 Cr Buyback
Wipro's Q4 FY26 results show modest revenue growth, a 65% QoQ surge in large deal bookings, and a ₹15,000 crore buyback. Q1 FY27 guidance points to flat-to-negative sequential growth.
Wipro Q4 FY26 Results: Wipro reported gross revenue of ₹242.4 billion for Q4 FY26 (January–March 2026), up 2.9% QoQ and 7.7% YoY. Net profit was ₹35.0 billion, up 12.3% QoQ but down 1.9% YoY. IT services revenue was $2,651 million (+0.6% QoQ, +2.1% YoY). Operating margin held at 17.3%. Large deal bookings surged 65.1% QoQ to $1.44 billion, with full-year FY26 bookings at $16.4 billion (+14% YoY). The board approved a ₹15,000 crore buyback at ₹250 per share — the first since June 2023 — and declared ₹11 per share as the final dividend for FY26. Q1 FY27 IT services revenue guidance: $2,597–$2,651 million (−2% to 0% in constant currency).
Wipro's Q4 FY26 results come at a time when IT earnings are being closely tracked for signals on demand recovery, deal momentum, and profitability. Following TCS, Wipro's numbers add another data point to how the sector is currently shaping up, and the numbers tell a story of modest sequential recovery, strong deal wins, and a management that is returning cash to shareholders rather than betting on a sharp revenue acceleration.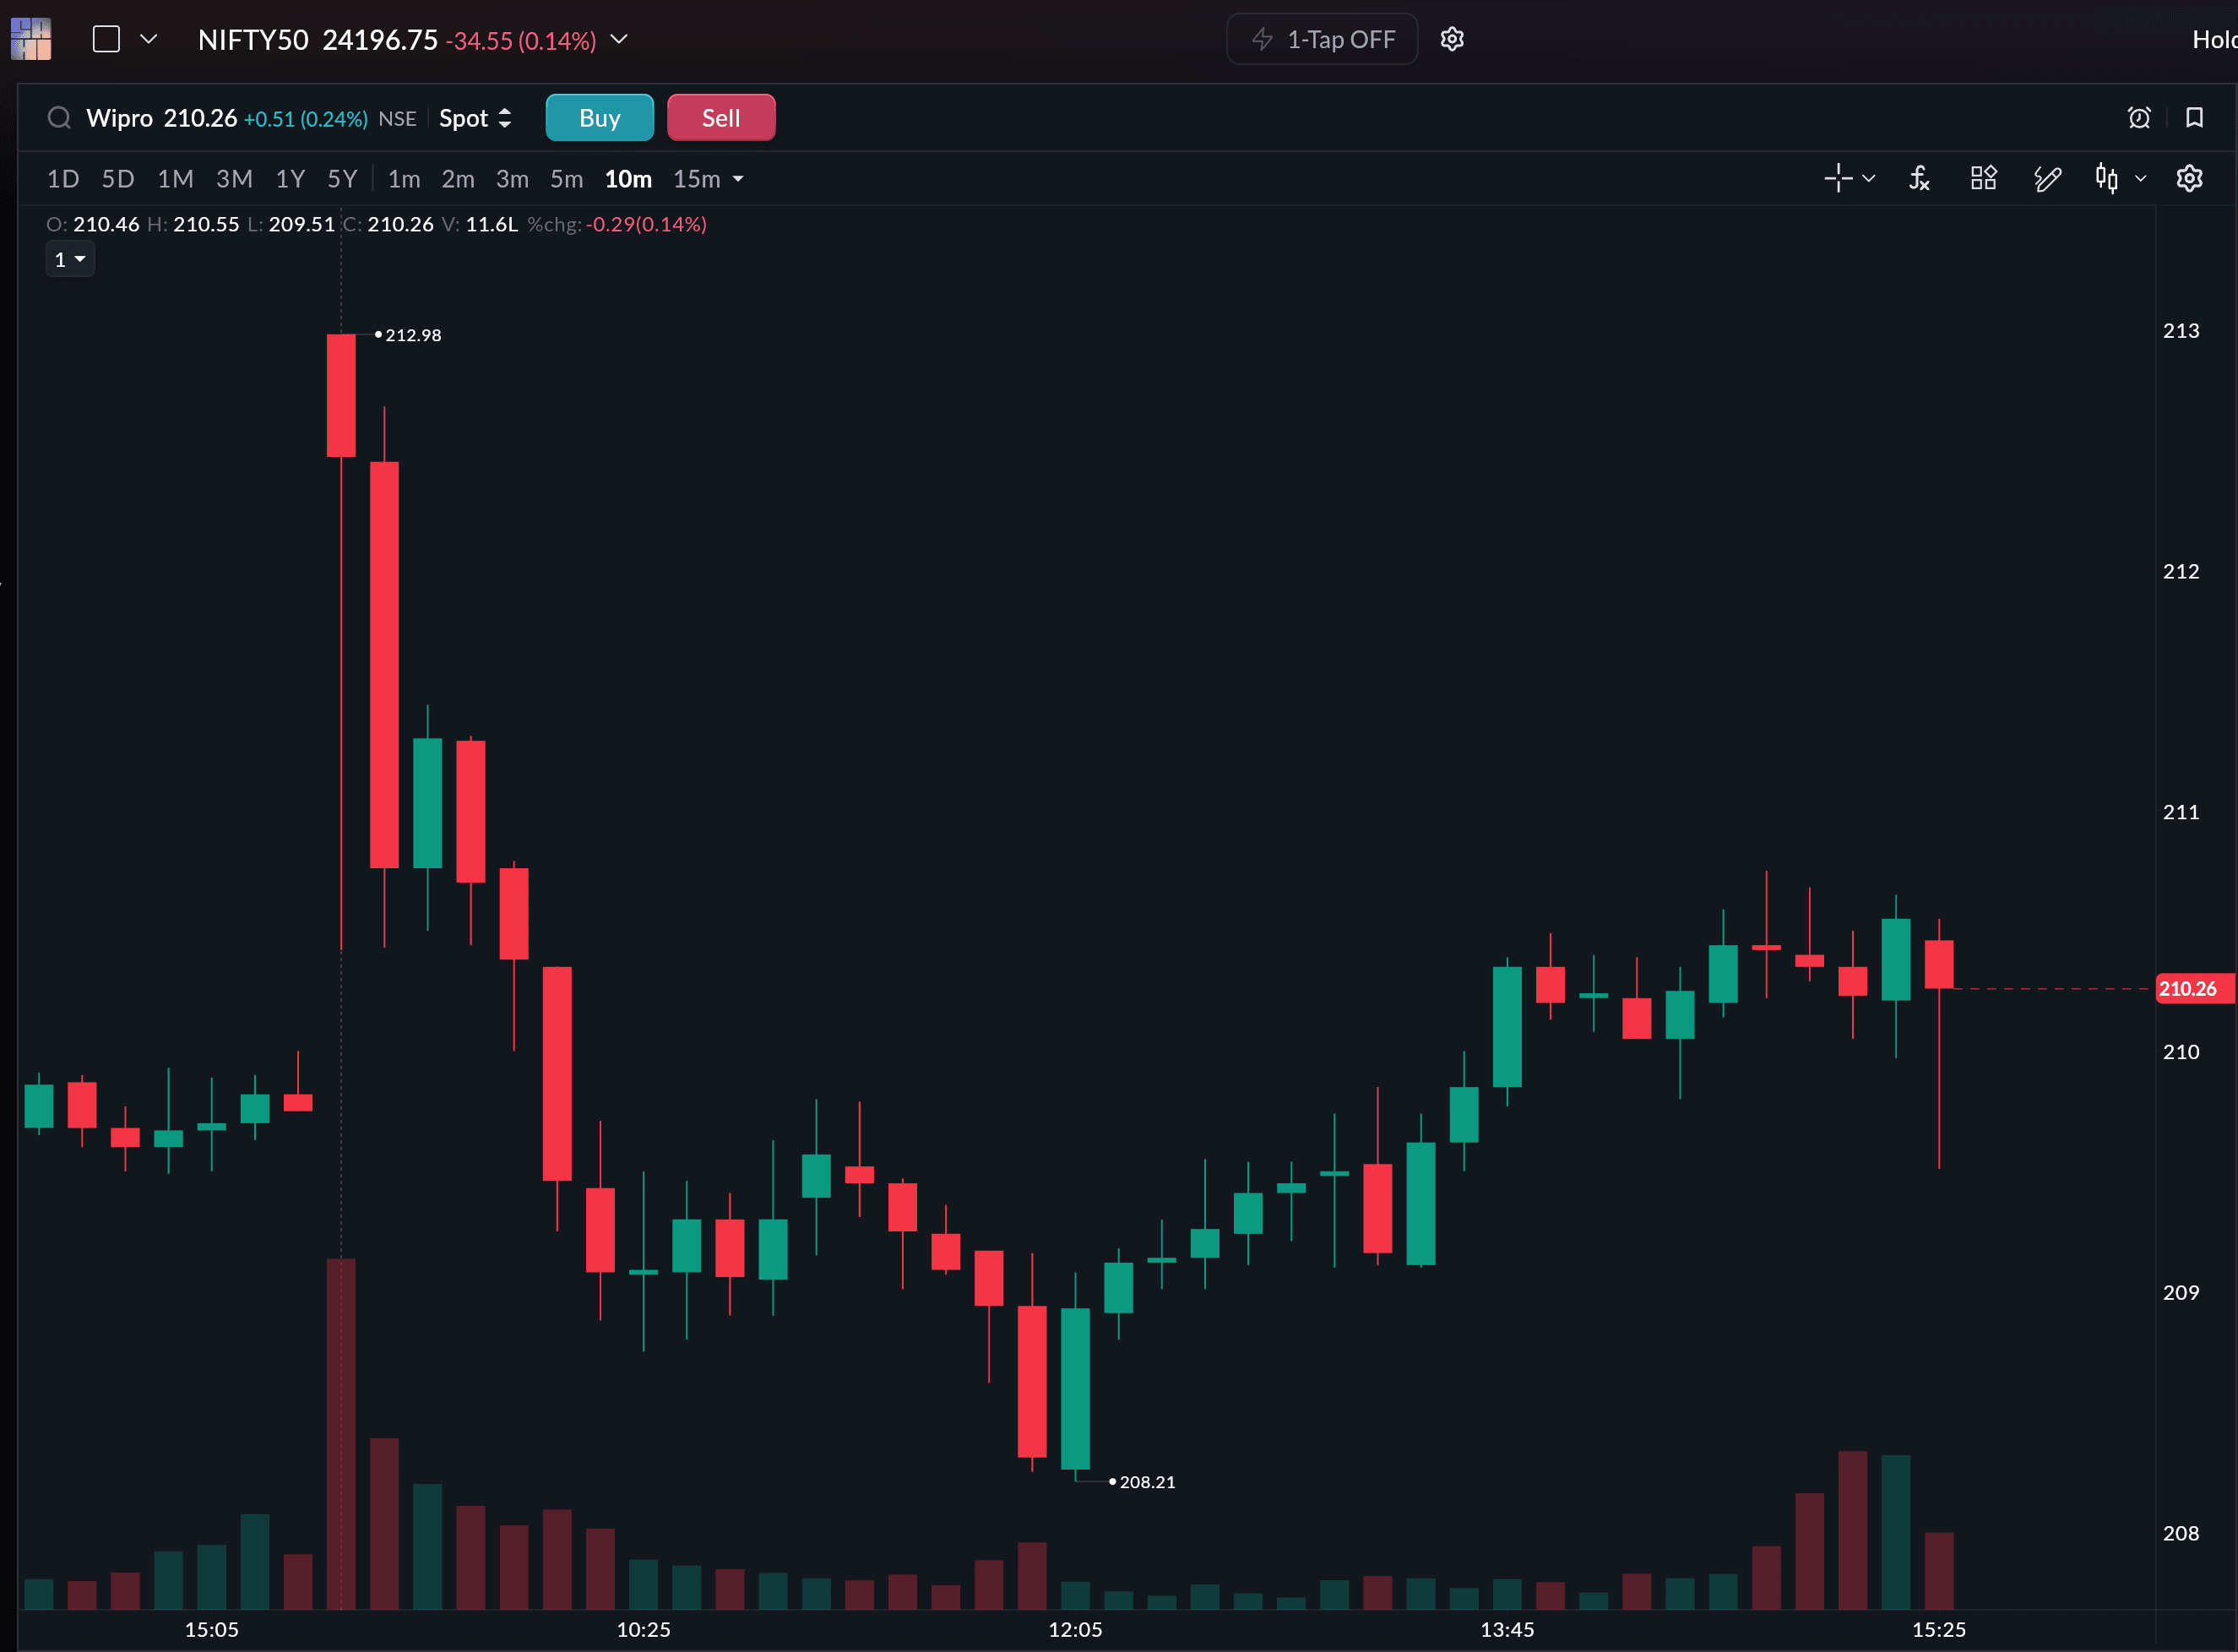
The stock closed 0.24% higher on April 16, 2026, ahead of the results announcement after market hours. Here's the broader context on what India's IT sector is facing this earnings season.
Q4 FY26 Financial Performance
| Metric | Q4 FY26 | Q3 FY26 | Q4 FY25 | QoQ Change | YoY Change |
|---|---|---|---|---|---|
| Gross Revenue | ₹242.4 billion | ₹235.6 billion | ₹225.0 billion | +2.9% | +7.7% |
| IT Services Revenue (USD) | $2,651 million | $2,635 million | $2,597 million | +0.6% | +2.1% |
| Net Profit (PAT) | ₹35.0 billion | ₹31.2 billion | ₹35.7 billion | +12.3% | −1.9% |
| IT Services Operating Margin | 17.3% | 17.6% | 17.5% | −0.3% | −0.2% |
| EPS (Basic) | ₹3.34 | ₹2.98 | ₹3.41 | +12.1% | −2.1% |
| Operating Cash Flow | ₹31.7 billion | — | ₹37.4 billion | — | −15.3% |
Source: Wipro Q4 FY26 press release, NSE/BSE filing, April 16, 2026
The sequential profit jump of 12.3% is partly explained by Q3 FY26 being impacted by a one-time labour code adjustment. Adjusted for that, the underlying QoQ profit growth was 3.7%. Revenue growth remained modest, with IT services dollar revenue growing just 0.6% sequentially, largely in line with guidance.
Deal Bookings and Pipeline
The most notable aspect of the quarter was the sharp acceleration in large deal activity.
| Metric | Q4 FY26 | Q3 FY26 | QoQ Change |
|---|---|---|---|
| Total Bookings (TCV) | $3,455 million | $3,335 million | +3.2% (CC) |
| Large Deal Bookings (≥$30M TCV) | $1,440 million | $871 million | +65.1% (CC) |
Source: Wipro Q4 FY26 press release, NSE/BSE filing, April 16, 2026. CC = constant currency.
Large deals are multi-year contracts that contribute to future revenue visibility — their revenue impact accrues gradually over the contract tenure rather than immediately in the quarter they are booked. The 65.1% QoQ jump in large deal TCV is a meaningful signal of demand for longer-duration, higher-value engagements.
Full-Year FY26 Performance
| Metric | FY26 | FY25 | YoY Change |
|---|---|---|---|
| Gross Revenue | ₹926.2 billion | ₹890.9 billion | +4.0% |
| IT Services Revenue (USD) | $10,478 million | $10,512 million | −0.3% |
| Total Bookings | $16.4 billion | $14.3 billion | +14.0% (CC) |
| Large Deal Bookings | $7.8 billion | $5.4 billion | +45.4% (CC) |
| Net Profit | ₹132.0 billion | ₹131.4 billion | +0.5% |
| EPS (Basic) | ₹12.60 | ₹12.56 | +0.3% |
| IT Services Operating Margin | 17.2% | 17.1% | +0.2% |
| Operating Cash Flow | ₹149.3 billion | ₹169.5 billion | −11.9% |
| Operating CF as % of Net Income | 112.6% | — | — |
Source: Wipro Q4 FY26 press release, NSE/BSE filing, April 16, 2026
The divergence between flat-to-negative IT services dollar revenue (−0.3% YoY) and the strong growth in bookings (+14% total, +45% large deals) is the key tension in Wipro's FY26 story. Revenue is a lagging indicator of what was booked in prior quarters. Bookings are a leading indicator of what could convert to revenue in FY27. The question the market is asking is how much of the large deal pipeline converts and how quickly.
Margins, Cash Flow and Operational Metrics
| Metric | Q4 FY26 | FY26 |
|---|---|---|
| IT Services Operating Margin | 17.3% | 17.2% |
| Operating Cash Flow | ₹31.7 billion | ₹149.3 billion |
| Operating CF as % of Net Income | 90.1% | 112.6% |
| Attrition (TTM, voluntary) | 13.8% | 13.8% |
| Total Headcount | 242,156 | 242,156 |
Source: Wipro Q4 FY26 press release, NSE/BSE filing, April 16, 2026
Revenue Mix by Sector and Geography
| Sector | Q4 FY26 Contribution |
|---|---|
| Banking, Financial Services & Insurance (BFSI) | 34.1% |
| Consumer | 18.4% |
| Technology & Communications | 16.8% |
| Energy, Manufacturing & Resources | 16.5% |
| Health | 14.2% |
Source: Wipro Q4 FY26 press release, NSE/BSE filing, April 16, 2026
Capital Allocation: Buyback and Dividend
| Detail | Value |
|---|---|
| Buyback size | ₹15,000 crore (₹150 billion) |
| Buyback price | ₹250 per share |
| Shares to be bought back | Up to 60 crore equity shares (5.7% of paid-up capital) |
| Buyback method | Tender offer (proportionate basis) |
| Subject to | Shareholder approval via postal ballot |
| Previous buyback | ₹12,000 crore at ₹223/share (June 2023) |
| Final dividend FY26 | ₹11 per share (interim dividends declared July 2025 and January 2026, treated as final) |
Source: Wipro board resolution, April 16, 2026; NSE/BSE filing
The buyback is Wipro's first since June 2023. With cash reserves of ₹41,510 crore as of December 2025, the company has ample capacity to fund it. The ₹250 buyback price represents a meaningful premium to recent trading levels. Subject to shareholder approval via postal ballot, the buyback will proceed as a tender offer.
Outlook for Q1 FY27
| Metric | Guidance |
|---|---|
| IT Services Revenue range | $2,597 million to $2,651 million |
| Sequential growth (constant currency) | −2.0% to 0% |
Source: Wipro Q1 FY27 guidance, April 16, 2026. Based on exchange rates: USD/INR 92.35, GBP/USD 1.34, EUR/USD 1.17.
The guidance midpoint implies broadly flat sequential revenue and a cautious near-term outlook. The negative end of the range (−2%) reflects macro uncertainty, potential client budget pressure, and fewer working days in Q1. For context, Wipro has now guided for flat-to-negative sequential growth for several consecutive quarters. The broader question of AI disruption and structural demand shifts in Indian IT continues to be the lens through which these guidance ranges are being interpreted by the market.
Disclaimer: This article is for informational purposes only and does not constitute financial advice. All figures are sourced from Wipro's official Q4 FY26 press release filed with NSE/BSE on April 16, 2026. Please consult a SEBI-registered advisor before making investment decisions.