
Maruti Suzuki Q4 FY26 Results: Revenue Jumps 29%, Profit Falls 7%
Revenue from operations hit ₹52,449 crore, and EBIT reached an all-time high, but PAT fell 7%. Here's the full breakdown.
Maruti Suzuki's Q4 FY26 revenue from operations rose 29% to ₹52,449 crore, driven by a 61% jump in exports and steady UV demand. But PAT fell 6.9% to ₹3,591 crore due to rising raw material costs and mark-to-market losses on investments. Operating EBIT hit an all-time high of ₹4,409 crore. The board declared a ₹140/share final dividend for FY26.
Maruti Suzuki has put out its Q4 FY26 numbers, and they're a mix of genuinely good and genuinely bad. Revenue and volumes are up sharply. The stock fell 2.5%. Both of those things are true, and the quarterly data explains why.
| Metric | Q4 FY26 | Q4 FY25 | YoY Change |
|---|---|---|---|
| Sales Volume (Units) | 676,209 | 604,635 | +11.8% |
| Net Sales (₹ million) | 500,787 | 388,391 | +28.9% |
| Op. EBITDA (₹ million) | 61,569 | 48,426 | +27.1% |
| Op. EBIT (₹ million) | 44,092 | 33,812 | +30.4% |
| PBT (₹ million) | 48,360 | 48,618 | -0.5% |
| PAT (₹ million) | 35,905 | 38,573 | -6.9% |
Source: NSE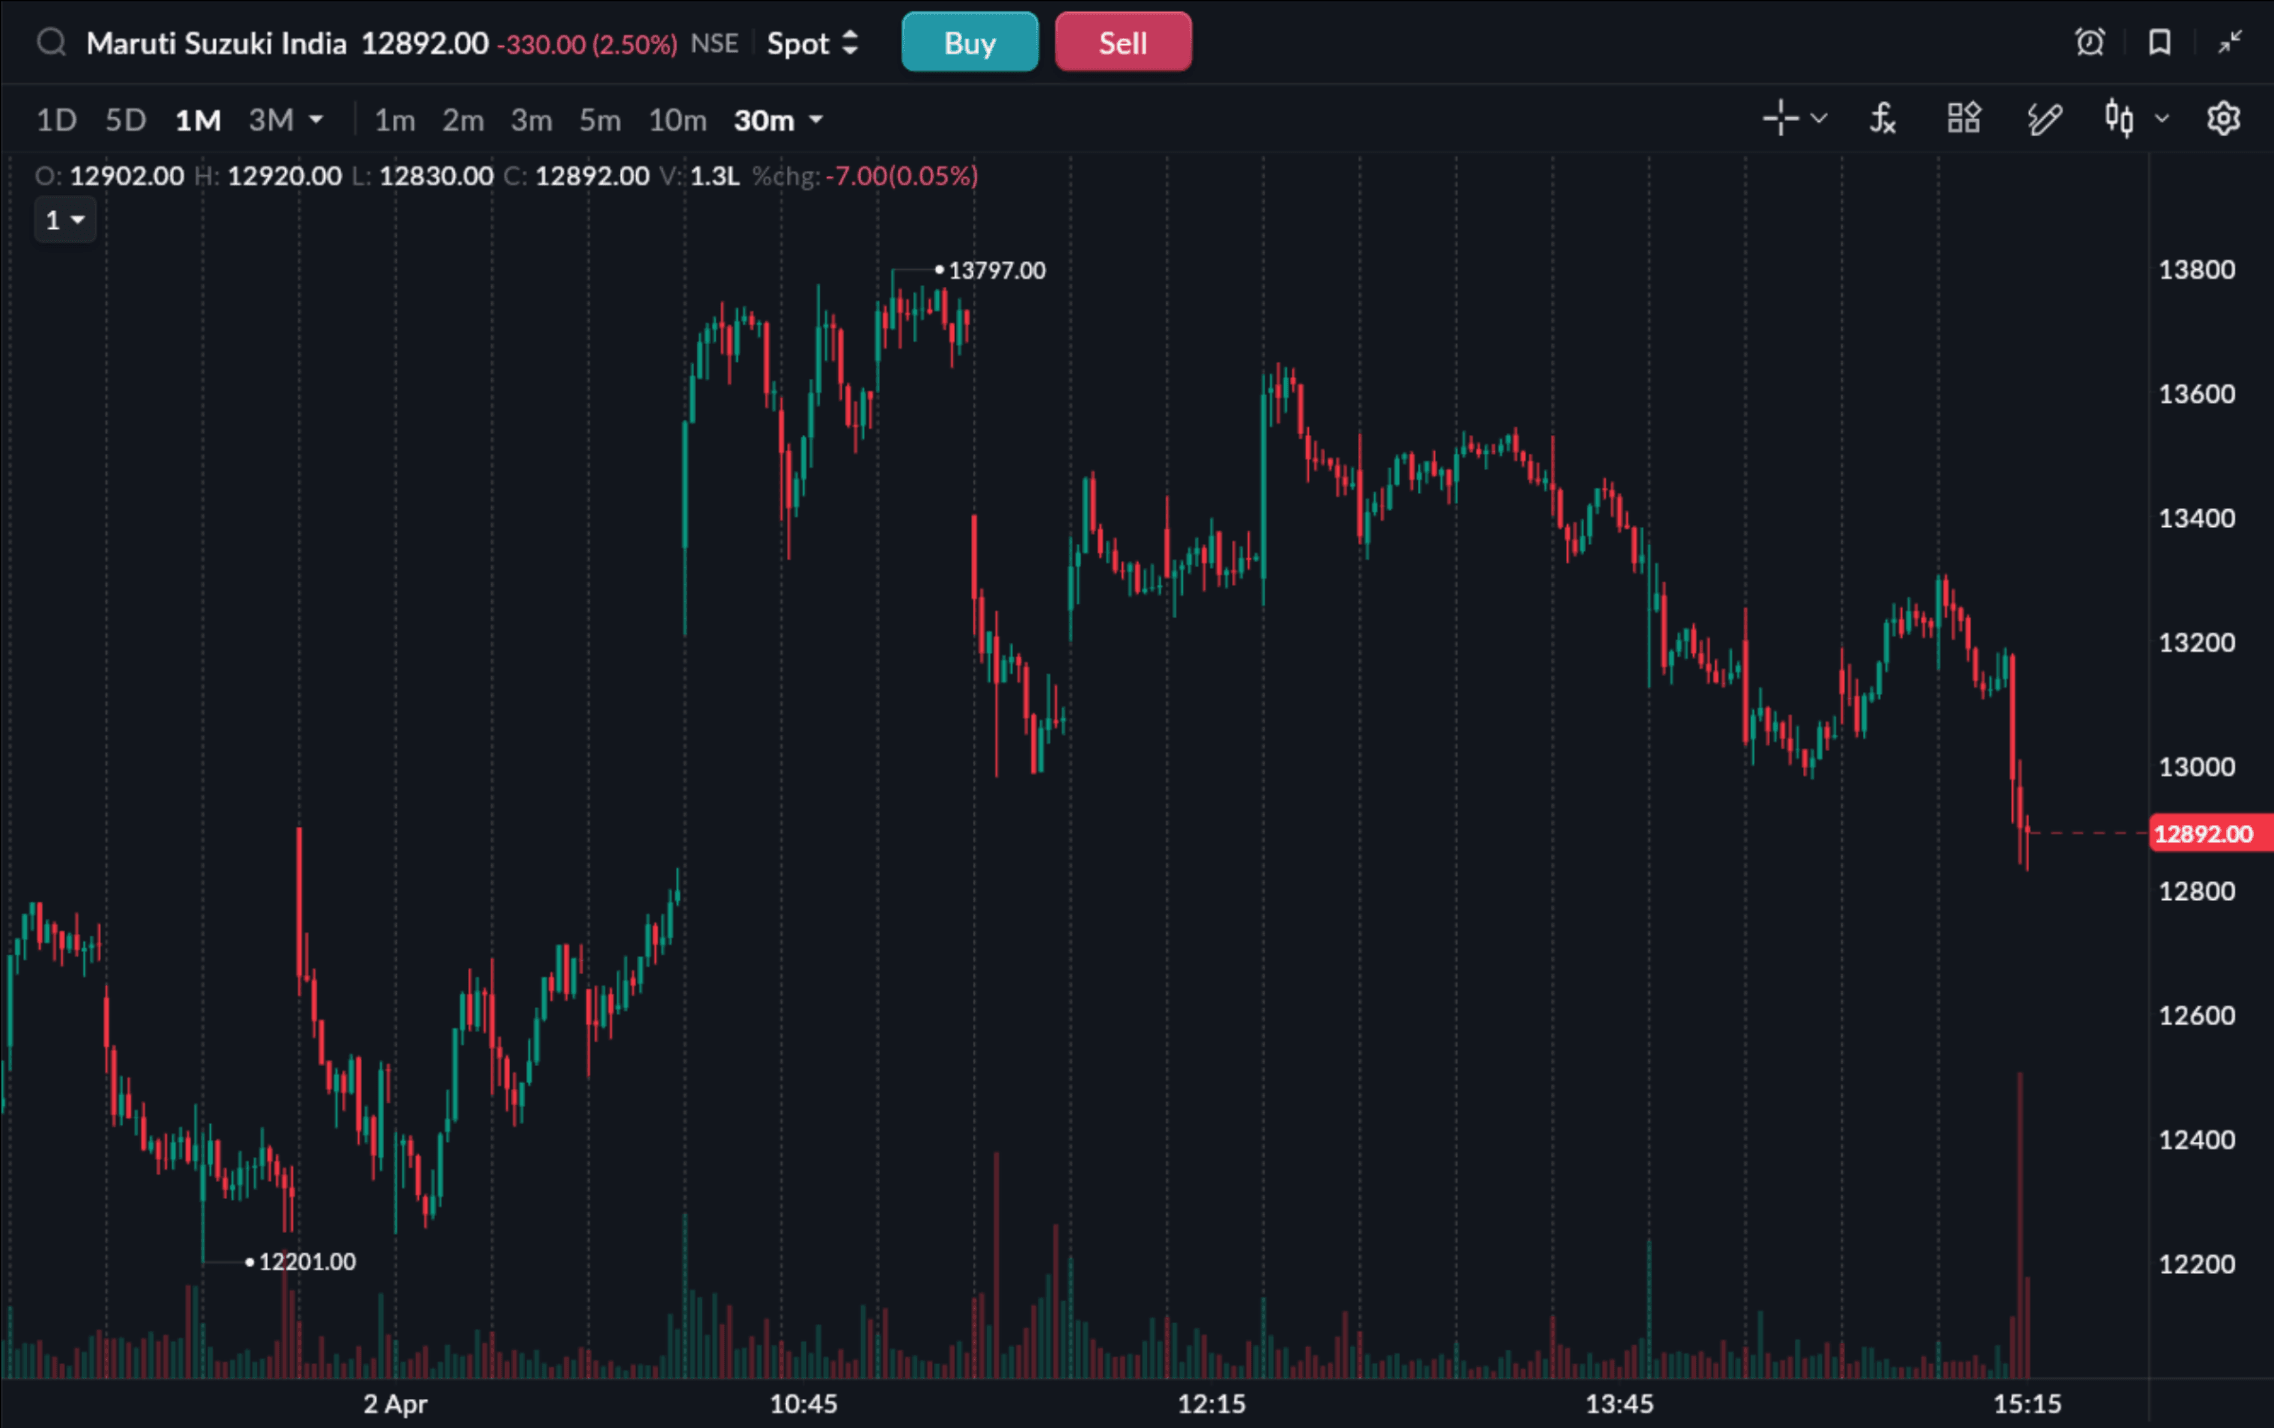
Revenue from operations reached ₹52,449 crore in the March quarter. Net sales grew 28.9% to ₹50,078.7 crore. Volume was up nearly 72,000 units year-on-year, which is solid in a market that doesn't exactly hand out growth.
The operating numbers look good. EBITDA and EBIT both grew above 27%. Operating EBIT hit ₹4,409 crore, an all-time high for the company.
PAT, though, fell 6.9% to ₹3,591 crore. The gap between operating performance and the bottom line comes down to two things: raw materials got more expensive, and the company took mark-to-market losses on its investment portfolio, which dragged down other income. The board recommended a ₹140/share final dividend for FY26.
Why margins came under pressure
EBITDA margin slipped 20 basis points, from 12.5% to 12.3%. That's a small move at the operating level. The bigger hit showed up lower in the P&L.
| Parameter | Q4 FY26 | Q4 FY25 | Change (bps) |
|---|---|---|---|
| Material Cost | 76.7% | 74.3% | +240 |
| Employee Cost | 4.5% | 4.6% | -10 |
| Other Expenses | 11.3% | 13.9% | -260 |
| Op. EBITDA | 12.3% | 12.5% | -20 |
| PBT | 9.7% | 12.5% | -280 |
| PAT | 7.2% | 9.9% | -270 |
Raw material costs are the main story. Material cost as a share of sales went up 240 bps, steel, aluminum, and electronics are all more expensive. Employee costs and other expenses were actually lower, so the company ran tight on the controllables. Selling expenses and ad spend both came down.
The bigger move is in PBT and PAT margins, which fell 280 and 270 bps, respectively. That's where the investment portfolio losses showed up. Operating profit was fine — it was below the EBIT line where things got messy.
Exports were the real story this quarter
Exports jumped 61.3% to 137,215 units — 20.3% of total Q4 volume. Domestic sales came in at 538,994 units, up 3.7%.
When one quarter's exports contribute a fifth of your total volume, it changes how you read the business. Maruti has been expanding aggressively into Africa, Latin America, and the Middle East, and Q4 is the most visible payoff of that push so far. This also means exports were responsible for most of the volume growth; domestic grew just 3.7%, while the overall number was 11.8%.
For investors, a higher export share means more revenue diversification away from India's domestic demand cycles. It's a real earnings lever, not just a good headline.
The SUV shift continues eating into entry-level volumes
UV sales rose 14.9% to 219,721 units, over 40% of domestic volume. Mini and compact segments were slower. Compact actually fell 5%.
This has been playing out for two years now, and it's sharpening rather than stabilising. Buyers are moving up the value chain, and Maruti has products to catch that—Brezza, Grand Vitara, Invicto, and now the Victorious. But it does mean the entry-level mass market that built the company is growing more slowly.
Full-year FY26 performance
| Metric | FY26 | FY25 | Growth |
|---|---|---|---|
| Sales Volume | 2,422,713 | 2,234,266 | +8.4% |
| Net Sales (₹ million) | 1,743,695 | 1,450,980 | +20.2% |
| Op. EBITDA (₹ million) | 214,502 | 201,492 | +6.5% |
| PAT (₹ million) | 144,454 | 142,976 | +1.0% |
Maruti crossed 24 lakh units for the year. Revenue grew 20%. PAT grew just 1% — cost pressure ran through most of FY26, not just Q4. Record exports of 4.48 lakh units for the full year are a bright spot that tends to get missed in the focus on PAT.
What the numbers actually tell you
Revenue and volume growth are strong — most carmakers would take these numbers. The problem is that commodity costs are eating into that growth at the bottom line. Operating profit is fine, actually exceptional given the all-time high EBIT. The PAT dip is real, but it's partly driven by investment portfolio noise (mark-to-market) that doesn't necessarily repeat.
The export acceleration is the number worth watching. If Maruti is genuinely building a global base — not just selling off excess inventory abroad — then the earnings diversification story is real. The market's 2.5% reaction prices in the profit miss but doesn't fully reflect that possibility.
Maruti's operating EBIT hit an all-time high this quarter. The PAT miss is real, but it's driven by investment losses and commodity costs — not a deterioration in the core business.
Disclaimer: This article is for informational purposes only and does not constitute investment advice. Please consult a registered financial advisor before making any investment decisions.