
Bandhan Bank Q4FY26 Results: Net Profit Up 68%, Stock Hits 52-Week High
Bandhan Bank Q4FY26 results showed net profit rising 68% YoY to ₹534 crore, driven by a 46% fall in provisions to ₹680 crore. Gross NPA improved to 3.3% from 4.7%, NIM expanded 30 bps to 6.2%, and the secured loan book reached 56.2% of total advances. The stock hit a 52-week high of ₹200.89 on April 29, 2026, gaining over 10% intraday on the NSE.
Bandhan Bank shares rose over 10% on April 29, 2026, hitting a fresh 52-week high of ₹200.89 on the NSE after Q4FY26 results came in better than expected. Net profit jumped 68%, bad loans continued falling, and the secured loan book crossed 56% of total advances for the first time.
The results are worth reading carefully. For the past two years, Bandhan Bank has been largely in damage-control mode—managing EEB slippages, reducing unsecured microfinance exposure, and trying to rebuild investor confidence. This quarter, that work is starting to show up in the numbers.
Q4FY26 earnings: the numbers
Net profit came in at ₹534 crore, up 68% from ₹318 crore in Q4FY25. The previous quarter (Q3FY26) had seen a profit of ₹212 crore, so the sequential recovery is also sharp.
NII grew 1.4% YoY to ₹2,796 crore. Non-interest income rose 10.2% year-over-year to ₹770 crore, helped by third-party income and gains from loan sales to asset reconstruction companies. Total net revenue was ₹3,570 crore, up 3.2% YoY.
The number that drove the stock: provisions. The bank set aside ₹680 crore toward loan losses in Q4, down 46% from ₹1,260 crore a year ago and down 41% from Q3FY26. Profit Before Tax nearly tripled, from ₹310 crore to ₹770 crore.
| Metric | Q4FY26 | Q4FY25 | Change |
|---|---|---|---|
| Net Profit | ₹534 Cr | ₹318 Cr | +68% |
| Net Interest Income | ₹2,796 Cr | ₹2,756 Cr | +1.4% |
| Non-Interest Income | ₹770 Cr | ~₹699 Cr | +10.2% |
| Total Net Revenue | ₹3,570 Cr | ₹3,460 Cr | +3.2% |
| Provisions | ₹680 Cr | ₹1,260 Cr | -46% |
| Profit Before Tax | ₹770 Cr | ₹310 Cr | +145% |
| Net Interest Margin | 6.2% | — | +30 bps QoQ |
Source: Bandhan Bank Q4FY26 results, NSE filings
NIM is moving in the right direction
Net interest margin reached 6.2% in Q4FY26, up 30 basis points from 5.9% in Q3. The bank has guided for a further 10–20 bps expansion over the next two to three quarters as term deposits reprice. The exit FY27 NIM target is around 6.5% on earning assets. The share price also rose over 12% after the announcement.
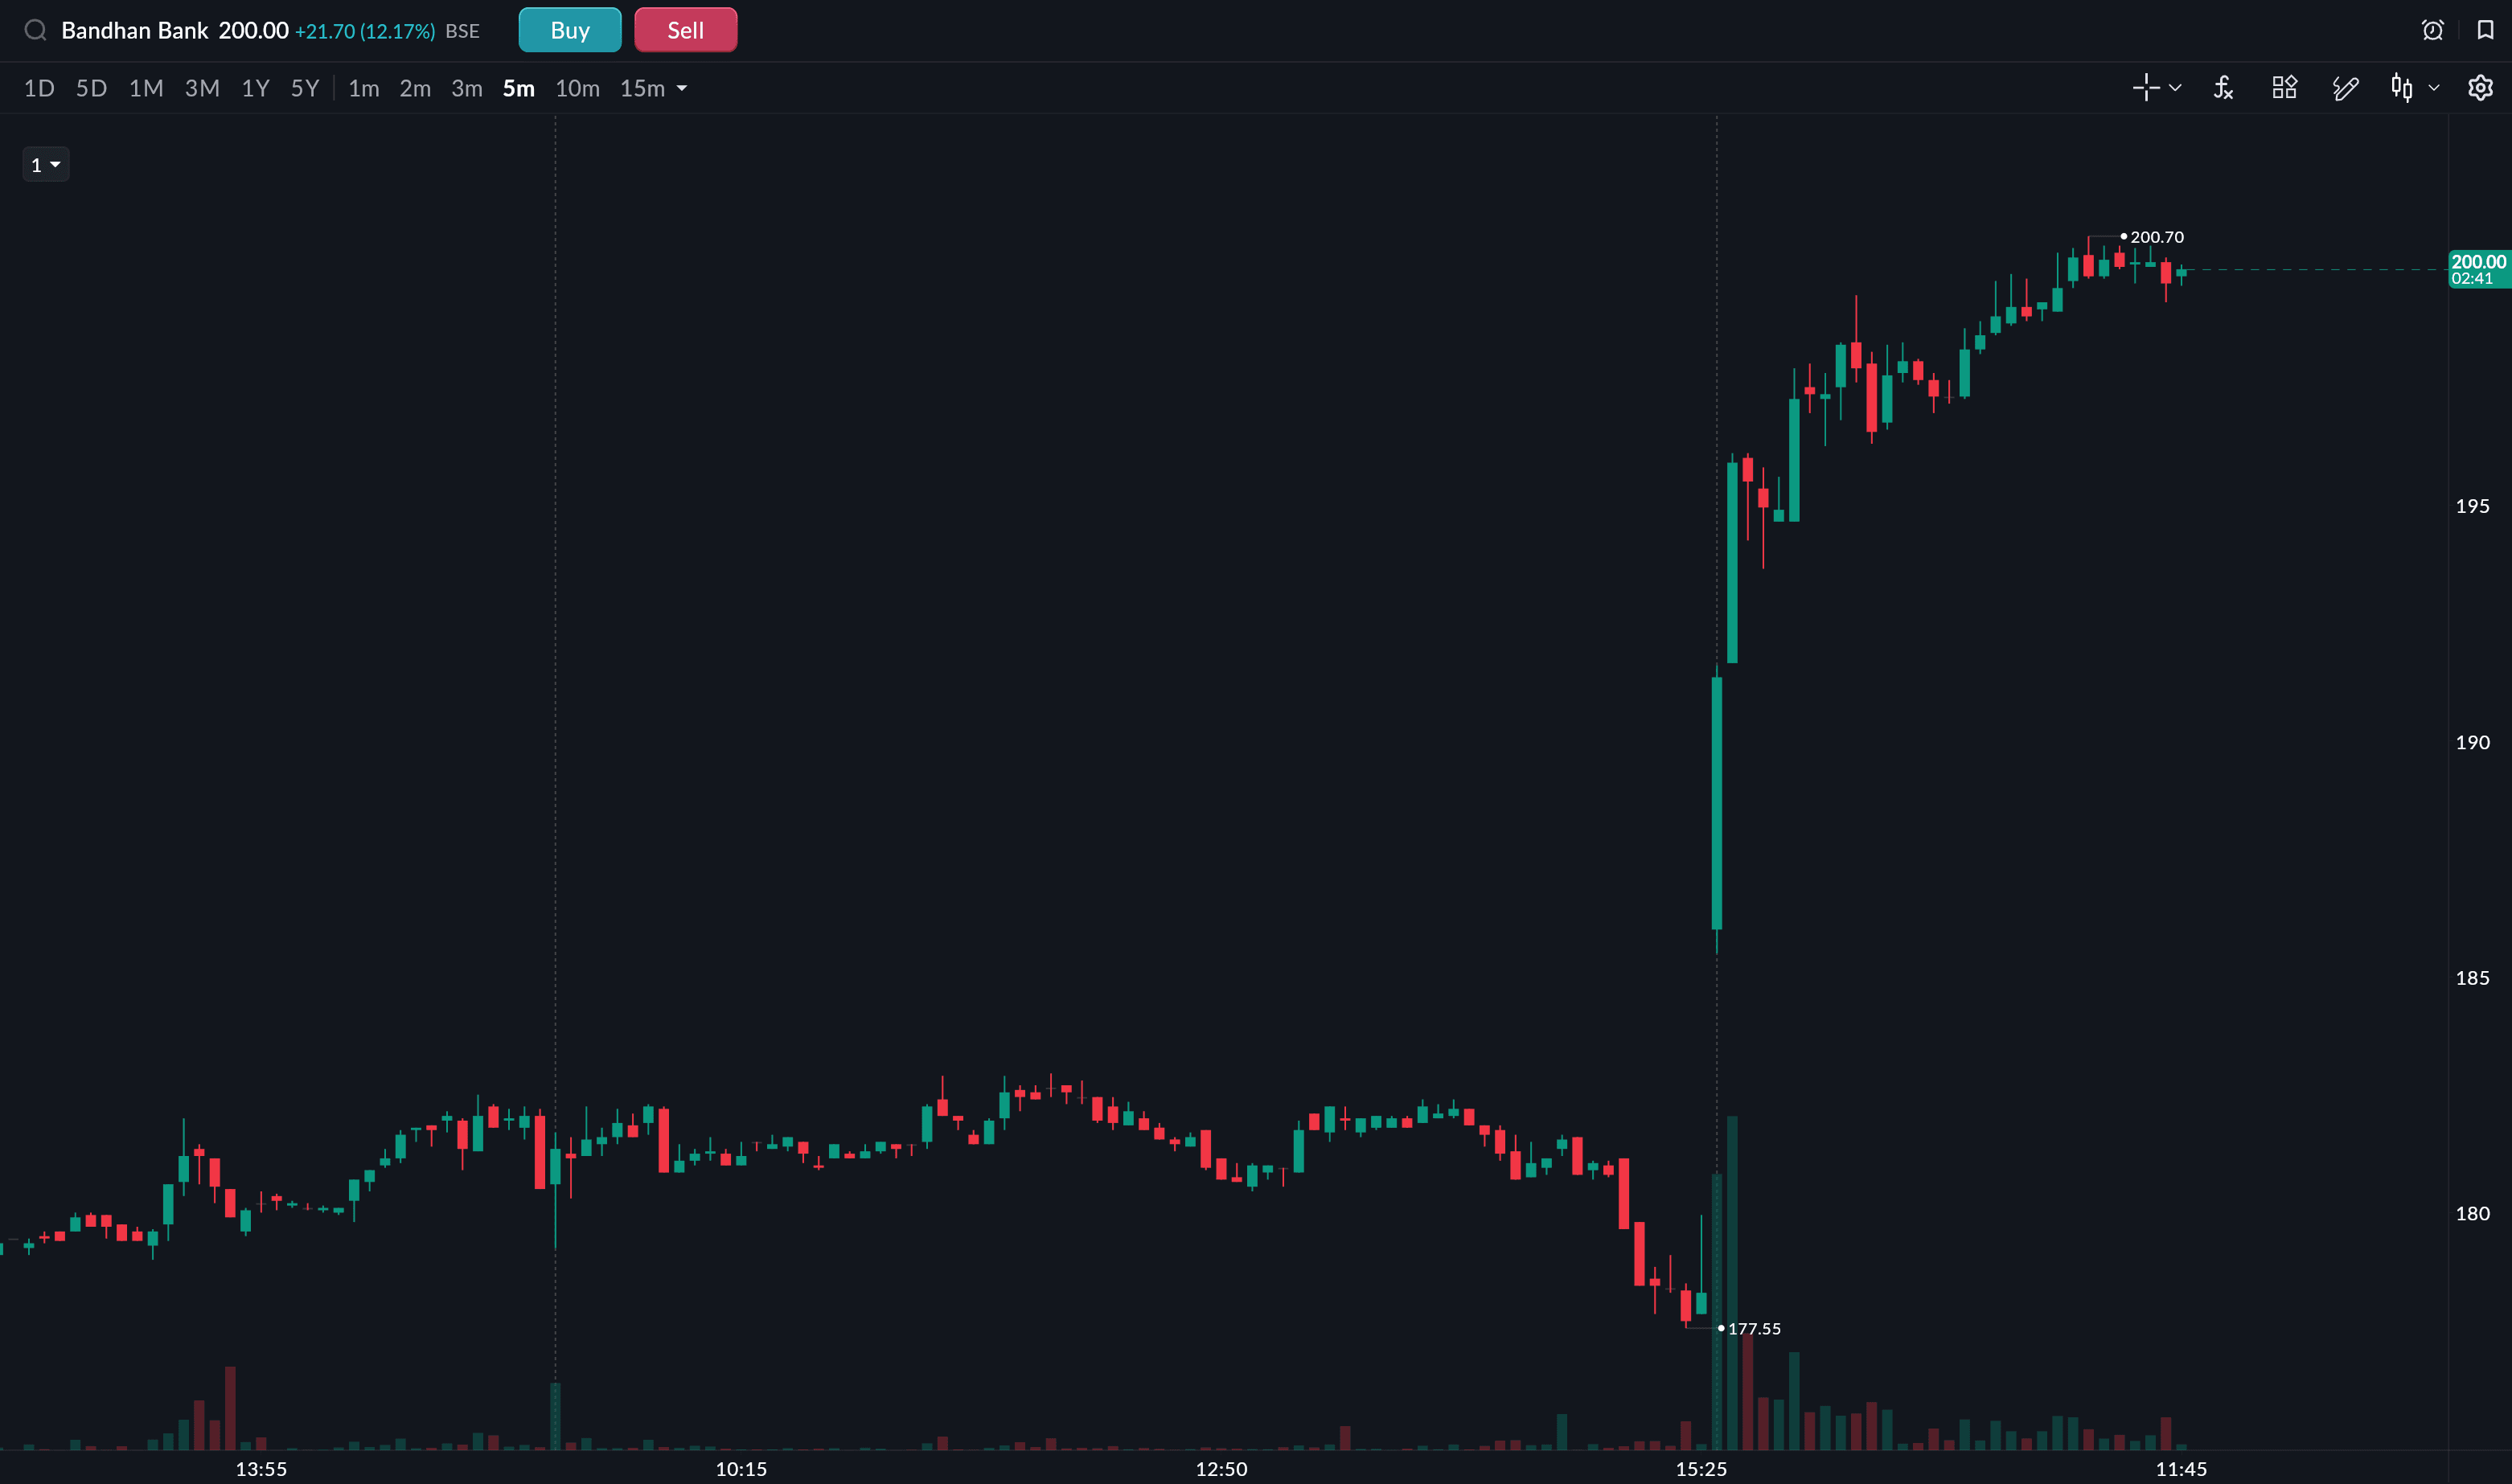
(Share price as of 11:50am)
NIM is worth watching because it directly affects how much money the bank keeps from every rupee lent. A rising NIM at a time when credit costs are also falling is a useful combination for earnings growth.
Asset quality
Gross NPA ratio fell to 3.3% from 4.7% a year ago, a decline of 144 basis points YoY. Net NPA improved to 1.0% from 1.3%. The provision coverage ratio is at 71.1%.
Credit cost came in at 2.0%, down from 3.9% in Q4FY25 and 3.3% in Q3FY26. Fresh slippages fell to ₹1,030 crore from ₹1,310 crore in Q3 and ₹1,750 crore in Q4 FY25. Collection efficiency in March 2026 was 98.9%, against 98.1% in March 2025.
Analysts at MOFSL noted that EEB slippages declined sharply and that "challenges in the EEB portfolio have largely normalized." Credit cost is expected to fall further to around 1.9% in FY27.
| Asset Quality Metric | Q4FY26 | Q4FY25 |
|---|---|---|
| Gross NPA ratio | 3.3% | 4.7% |
| Net NPA ratio | 1.0% | 1.3% |
| Provision Coverage Ratio | 71.1% | — |
| Credit Cost | 2.0% | 3.9% |
| Fresh Slippages | ₹1,030 Cr | ₹1,750 Cr |
| Collection Efficiency (March) | 98.9% | 98.1% |
The loan book is changing shape
Total gross advances grew 12.6% YoY to ₹1,54,235 crore. The secured loan book now makes up 56.2% of total advances, up from 42.1% in Q4FY24. In two years, the bank shifted more than 14% of its book into secured lending.
EEB and small business/agri exposure fell from 41.3% of the book in Q4FY25 to 35.0% in Q4FY26. Retail lending (excluding housing) grew 46% YoY. Wholesale banking grew 33% YoY. Housing grew 8% YoY. Housing and retail loans outstanding total ₹50,880 crore; wholesale banking stands at ₹48,450 crore.
The context matters here. In FY24 and FY25, it was the unsecured microfinance book that generated most of the stress. The bank has been deliberately reducing that exposure, and the shift is now visible at the portfolio level.
Deposits
Total deposits rose 10% YoY to ₹1,66,344 crore and 6.1% sequentially from Q3FY26. Retail deposits grew faster at 17.7% YoY to ₹1.22 lakh crore, now accounting for 73.7% of total deposits. That share was 68.9% a year ago and 72.4% in Q3.
The CASA ratio recovered to 29.3% from 27.3% in Q3FY26, though it is still below 31.4% from Q4FY25. Average savings account balance per general banking account rose to ₹38,900 from ₹36,700 the previous quarter.
Deposits sourced from outside the East region reached 45% of the total. Bandhan Bank's historical funding concentration in West Bengal and the Northeast has long been flagged as a risk, so this number is worth tracking.
Capital and operations
CRAR stands at 18.0% and the CET1 ratio at 17.3%. The bank has 1,955 branches, 4,400 EEB banking units, and 31.8 million customers. 98% of retail transactions happen digitally; 93% of savings accounts are opened digitally. Business per employee grew 10.7% YoY. The board declared a dividend of ₹1.5 per equity share for FY26.
Why the stock moved
Bandhan Bank's stock has been a frustrating hold for most of FY24 and FY25. Each quarter carried the hope that the worst was behind it, and each quarter something else showed up in the slippages data.
Q4 FY26 is the first quarter in a while where the underlying metrics moved together: profit up, NPAs down, margins up, and secured share up. That combination is what pushed the stock to a 52-week high. The market cap crossed ₹28,780 crore, and the PE ratio stands at 28.53 as of April 29.
The open question for FY27 is whether the credit cost improvement holds. The EEB book is still 35% of advances. But with collection efficiency at 98.9% and fresh slippages falling for three consecutive quarters, the near-term risk looks contained.